Understanding the RSX Indicator:
The RSX, or Relative Strength Quality Index, is a popular tool among traders, originally developed by Mark Jurik. Its widespread adoption speaks to its effectiveness, but like any indicator, it can generate false signals in certain market conditions. To minimize these pitfalls, many traders combine the RSX with various filtering methods, particularly level crossings. This post introduces a refined version of the RSX that incorporates dual filters to enhance its reliability.
What’s New in This Version:
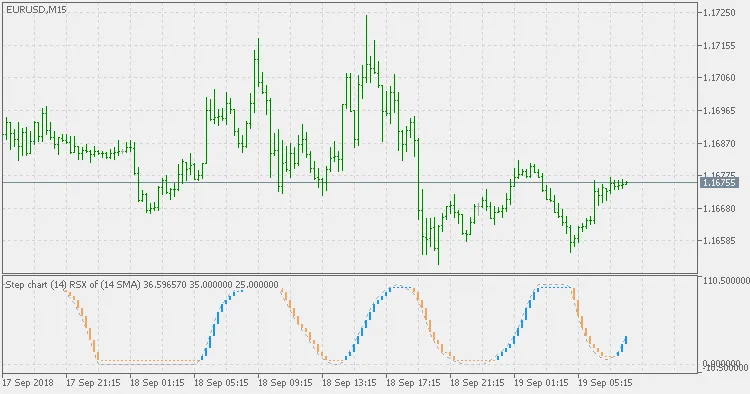
This updated version utilizes a step chart as a filter to reduce the volume of signals generated by the RSX, aiming to make trading both easier and safer. You can set a specific RSX percentage to determine the minimum change that qualifies as significant. Additionally, this version allows for price filtering before the stochastic calculation, leading to a “double filtering” approach. This means we filter the price before it’s used in the RSX calculation and then apply the step chart filter on the resulting RSX values.
The averages available for filtering in this version include:
- Simple Moving Average (SMA)
- Exponential Moving Average (EMA)
- Smoothed Moving Average (SMMA)
- Linear Weighted Moving Average (LWMA)
How to Use It:
Traders can interpret the color changes of the step bars as trading signals. A shift in color indicates a potential change in market momentum, which can guide your trading decisions. Keep an eye on these signals to make informed trades.
Related Posts
- Unlocking MetaCOT 2: Your Ultimate CFTC Indicator Toolkit for MT4
- Unlocking the Power of Master Tools for MetaTrader 4
- Unlock Trading Insights with Volume Profile + Range v6.0 for MetaTrader 5
- Unlock Trading Potential with the XMA JJRSX System for MetaTrader 5
- Mastering the Open Range Breakout Indicator for MetaTrader 5