What is the RSI Stop and Reverse Indicator?
The RSI Stop and Reverse indicator, often referred to as the RSI SAR, is a powerful tool for traders using MetaTrader 4. It combines the Relative Strength Index (RSI) with a stop and reverse mechanism, allowing you to make more informed trading decisions.
How Does It Work?
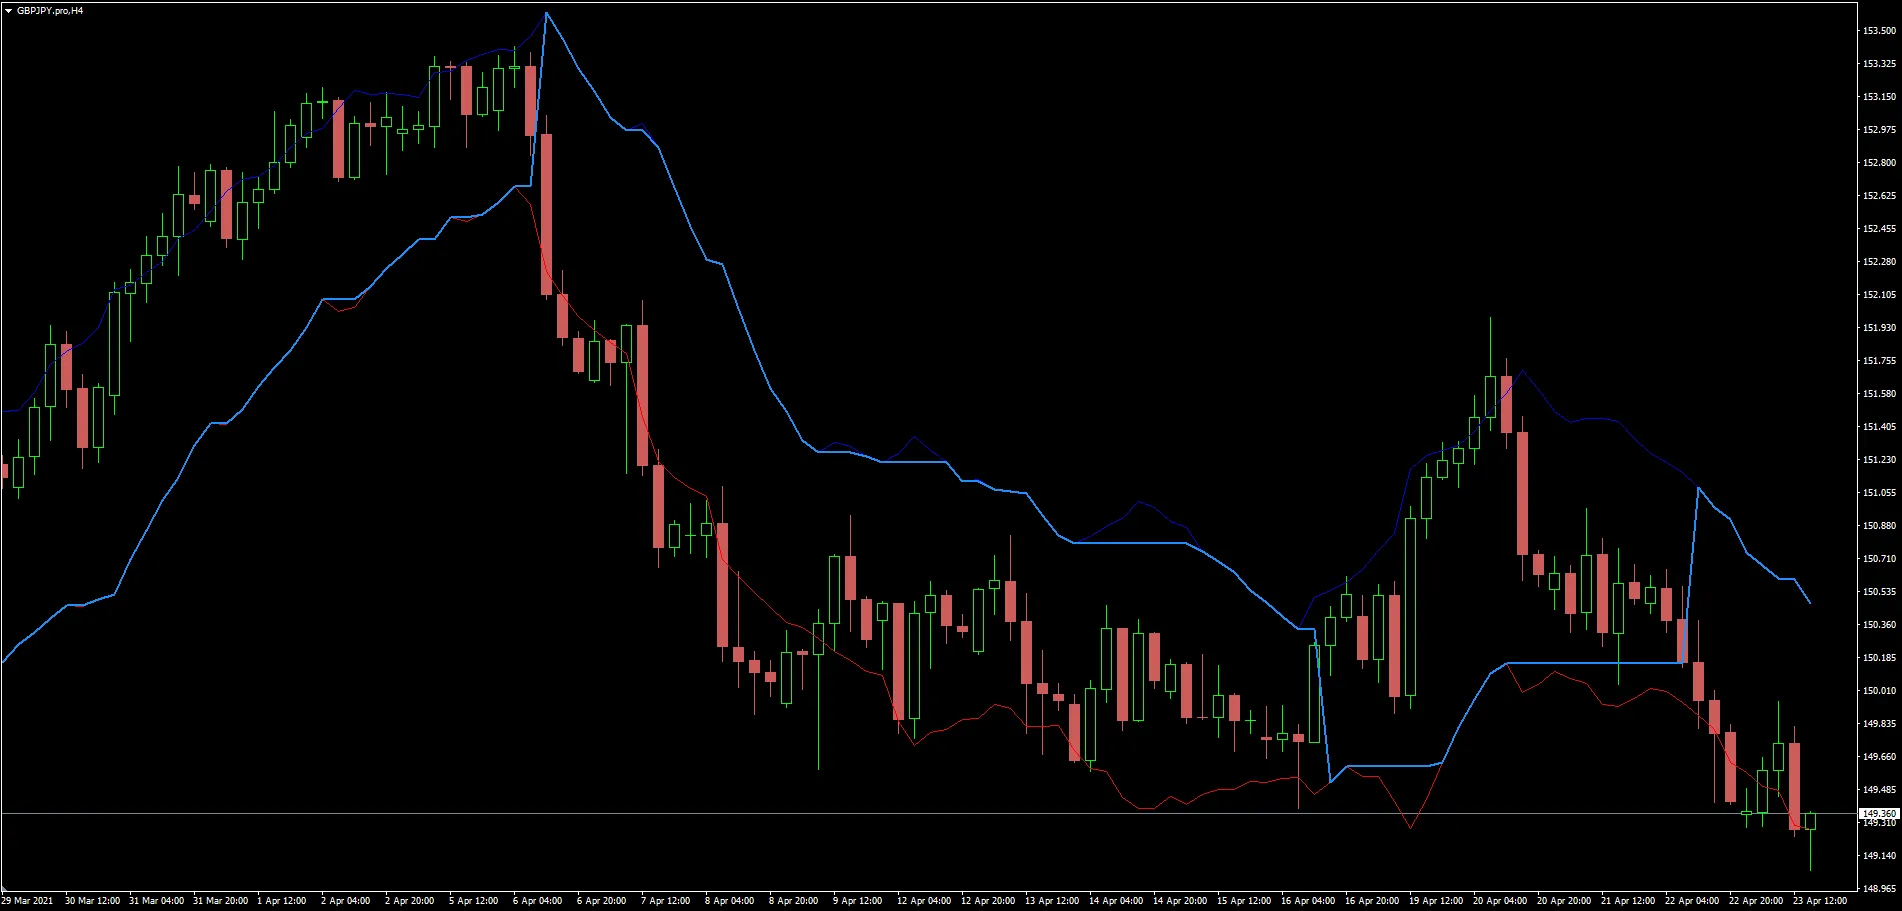
This indicator helps you identify potential reversals in the market by analyzing overbought and oversold conditions. When the RSI hits certain levels, it signals when to consider entering or exiting trades. Here's a quick breakdown:
- Overbought Levels: Typically above 70, indicating a potential reversal to the downside.
- Oversold Levels: Usually below 30, suggesting a potential reversal to the upside.
Why Use the RSI SAR?
Using the RSI SAR can enhance your trading strategy by providing clear signals on when to act. It’s particularly beneficial for day traders and swing traders looking to capitalize on short-term price movements.
Tips for Implementation
- Backtest the indicator on historical data to see how it performs in different market conditions.
- Combine it with other indicators for a more robust trading strategy.
- Always use risk management techniques to protect your capital.
Integrating the RSI Stop and Reverse indicator into your trading routine could just give you the edge you’re looking for. Happy trading!


Comments 0