Negative Volume Index (NVI) is a powerful technical indicator available for free on both MT4 and MT5 platforms, designed for traders who want to dive deep into chart analysis. This indicator leverages tick volume (or real volume in MT5) and comes packed with two handy features:
- Multi-timeframe (MTF) support for diverse trading strategies.
- Option to toggle and view the Positive Volume Index.
The NVI appears in a separate window beneath your main chart and operates independently of any standard or custom indicators. You can easily access this implementation on both MT4 and MT5.
What is the Negative Volume Index (NVI)?
The Negative Volume Index is a classic technical indicator, initially developed by Paul L. Dysart in the early 20th century and later refined by Norman G. Fosback in 1976. It features a single oscillating line in a dedicated indicator window, which moves upwards or downwards based on periods where the volume is less than that of the previous bar.
How to Utilize the Negative Volume Index (NVI)
Classic NVI Strategy
The traditional interpretation of the NVI is that its movement can confirm the strength of a trend. When the NVI aligns with the trend, it’s a strong indication that the trend will persist, even in the face of declining volumes. A crossover with its moving average can serve as a reliable trend confirmation signal.
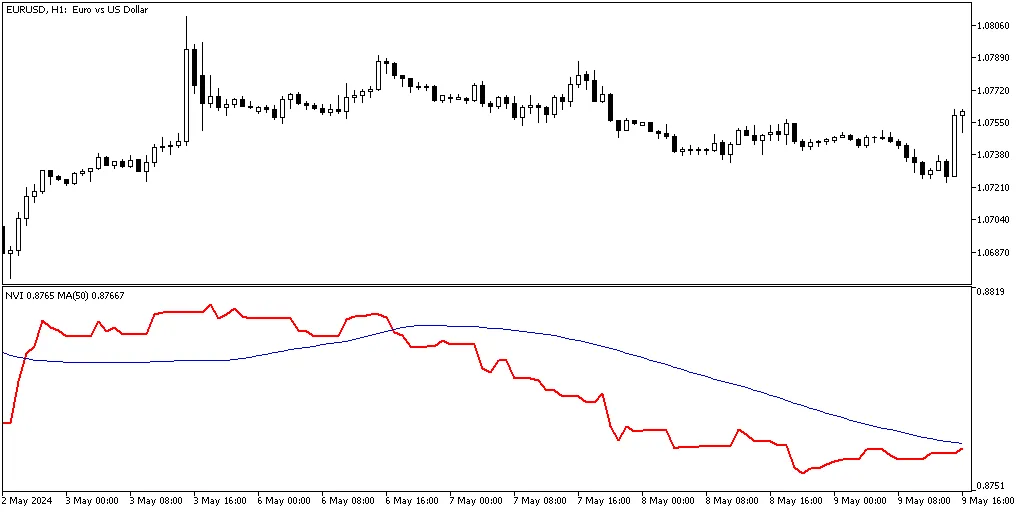
However, keep in mind that like any MA crossover strategy, this one can produce false signals or lag behind market movements.
NVI Divergence Strategy
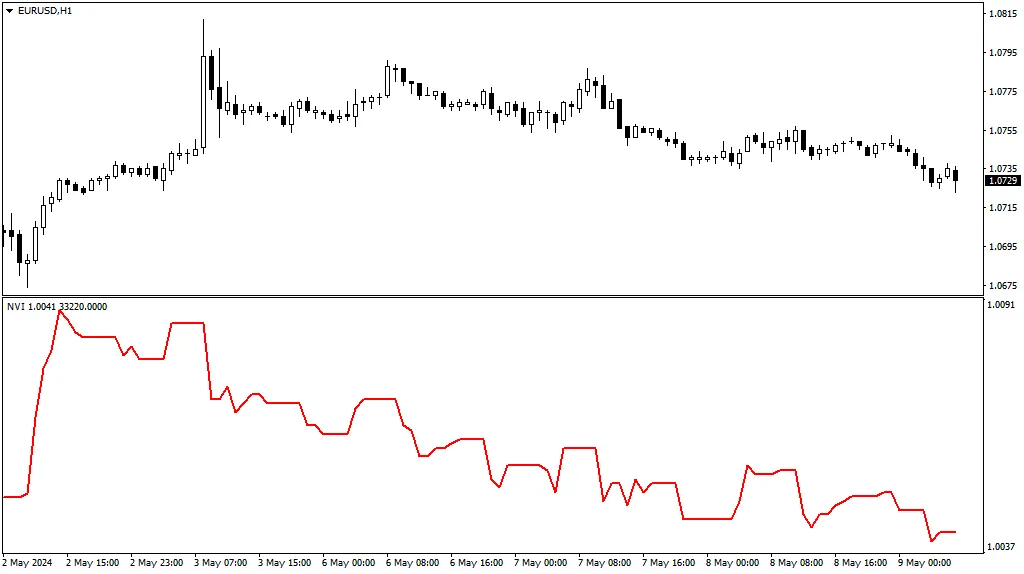
Another effective approach is to watch for divergences between the price chart and the NVI to identify potential trend reversals. For instance, if the price is making new highs while the NVI is showing lower lows, it might signal an impending downtrend:

That said, these signals can sometimes lack clarity. It’s wise to seek additional confirmations before making any trading decisions, just like with other divergence indicators.
Higher Timeframe Perspective
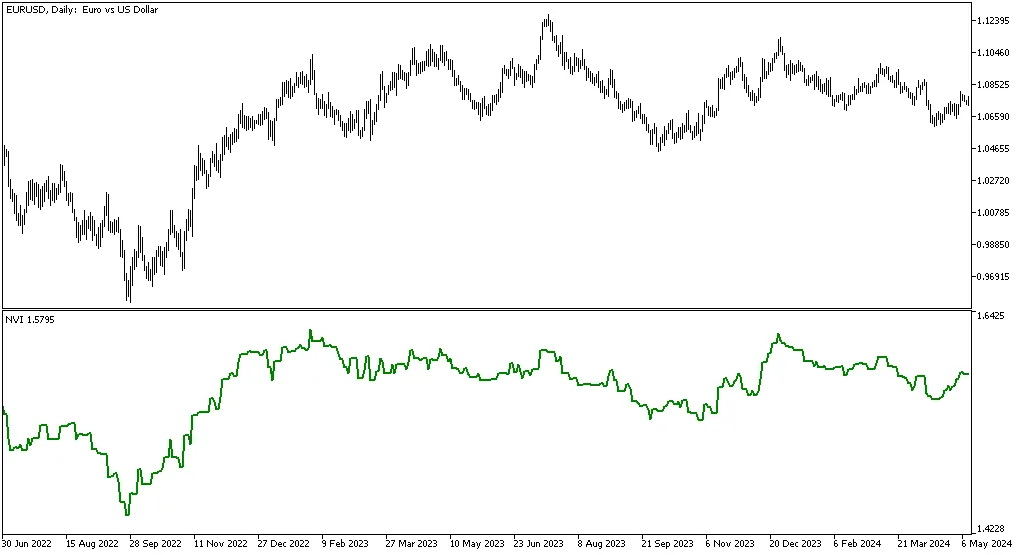
With our NVI setup, you can display higher timeframe NVI values even on lower timeframe charts. For example, here’s the EUR/USD chart from the D1 timeframe, now featuring the NVI from the weekly timeframe:


Keep in mind that the volume on higher timeframe bars can differ significantly from that on lower timeframe bars, which may lead to a different interpretation of market trends based on the resulting NVI curve.
Positive Volume Index (PVI)
You can also switch the NVI to calculate and display the Positive Volume Index, allowing you to see price movements paired with increasing volume. The resulting curve is quite similar to the price chart:
Generally, the PVI is regarded as less informative than the NVI.
NVI Input Parameters
- Indicator Shift (default = 0) — this parameter adjusts the horizontal shift of the indicator curve. You can set it to a positive value (to shift right) or a negative value (to shift left).
- Timeframe (default = Current) — this defines the timeframe for calculating the NVI line. If you select a higher timeframe, the indicator will show that higher timeframe's NVI on your current chart. If set to a lower timeframe, this parameter will be ignored.
- Positive Volume Index? (default = false) — set this to true to calculate the Positive Volume Index instead of the NVI.
- Volume Type (default = VOLUME_TICK) — this parameter chooses whether to use tick volume or real volume for calculations (only available in MT5).


Comments 0