Theory:
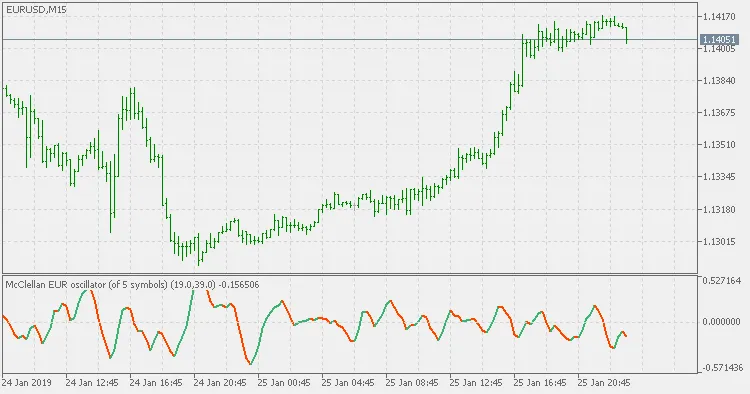
In 1969, Sherman and Marian McClellan developed the McClellan Oscillator, inspired by Haurlan’s analysis of advance and decline data. This oscillator measures the difference between two exponential moving averages of advances minus declines, specifically the 19-day and 39-day averages.
The idea behind this oscillator is straightforward: during intermediate-term overbought and oversold conditions, shorter moving averages typically react more quickly than their longer-term counterparts. If you wait for the moving averages to change direction, you might miss a significant price move. A ratio of two moving averages is much more responsive than relying on a single average, often reversing direction right alongside, or even before, a price reversal—especially when the ratio reaches extreme values.
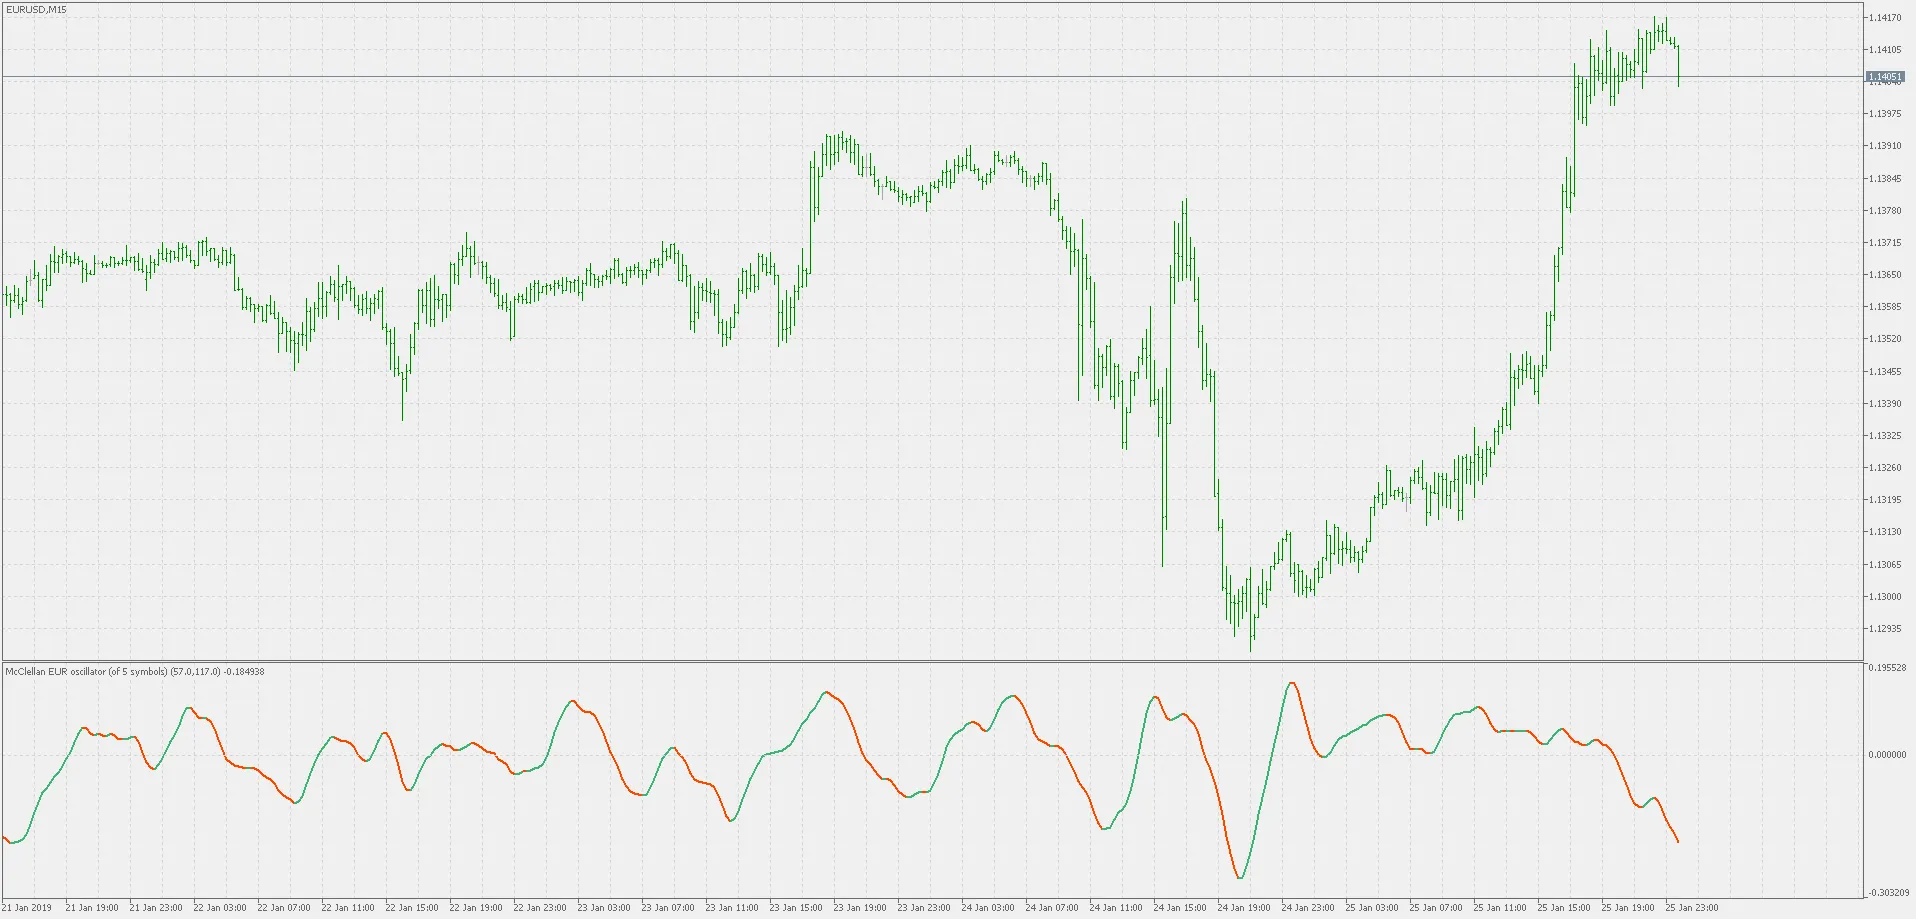
This updated version introduces a couple of enhancements:
- It utilizes a "smoother" for calculations, which yields significantly smoother results than traditional EMAs.
- A "periods multiplier" simplifies usage. Since the smoother reacts faster than the EMA, you can adjust the multiplier to your preference (even fractional values) instead of changing both the fast and slow periods for clearer readings.
Usage:
While it’s essential to use the oscillator as originally intended by its creators, I've found that this adapted version—especially with higher multiplier settings (like 3 in the second example)—can be a useful signal when zero crossing occurs on a chart with the corresponding base symbol.
Related Posts
- Unlocking the Power of Master Tools for MetaTrader 4
- Unlocking MetaCOT 2: Your Ultimate CFTC Indicator Toolkit for MT4
- Unlock Trading Insights with Volume Profile + Range v6.0 for MetaTrader 5
- Mastering the FE Fibonacci Expansion Indicator for MetaTrader 4
- Hourly Buffers for Data Collection in MetaTrader 5: A Simple Guide