The Keltner Channel: A Must-Have Indicator for Traders — Developed by Chester W. Keltner back in 1960, the Keltner Channel is a classic tool in technical analysis. It shares some similarities with Bollinger Bands and Envelopes, making it a favorite among traders. This indicator features three plotted lines: the middle line is a 10-day simple moving average calculated from the typical price ((high + low + close) / 3). The upper and lower bands are created by adding and subtracting the daily price range (the difference between High and Low) from this middle line. Essentially, it crafts a volatility-based channel that helps traders make informed decisions. You can tweak the moving average parameters in this version of the indicator, and it’s available for both MT4 and MT5 platforms.
Input Parameters
- MA_Period (default = 10) — This sets the period for the moving average (the middle line).
- Mode_MA (default = MODE_SMA) — This defines the type of moving average used for the middle line.
- Price_Type (default = PRICE_TYPICAL) — This indicates the price type applied to the moving average (the middle line).
Example and Strategy
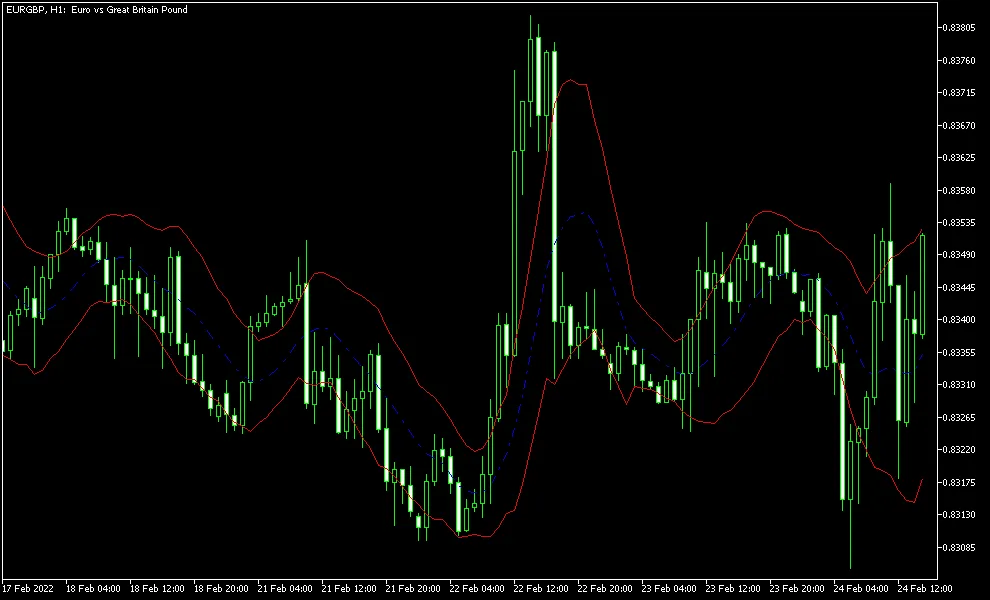

A straightforward strategy with the Keltner Channel involves going long when the price closes above the upper band and going short when it closes below the lower band. This strategy is a solid entry system; however, exits can be managed using various methods. For a more conservative approach, consider a tight stop-loss (as false signals can crop up). You might also opt for a distant take-profit target or exit when the price crosses the middle line. Many traders find it beneficial to use additional indicators for confirmation before making a move.
From a mathematical standpoint, the channel emphasizes the upper band during uptrends and the lower band during downtrends. This means that in a rising trend, the upper line is less likely to be breached, while the opposite holds true for established downtrends.


Comments 0