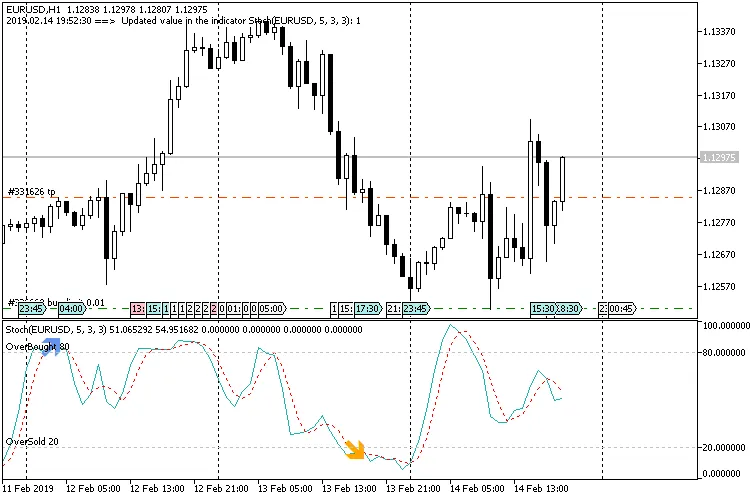
If you've ever watched a currency pair linger in the overbought or oversold zones, you know it can be quite a ride. The Engulfing Stochastic indicator is here to help you make sense of those moments. Whether you're on the hunt for reversals or riding the trend wave, this tool can be a game changer. Keep an eye out for bullish engulfing candles when the market is oversold, and bearish engulfing candles when it’s in overbought territory.
This indicator works like a charm: it will display a downward arrow when it spots a bearish engulfing candle crossing into the overbought or oversold line. Conversely, it shows an upward arrow for bullish candles making the same crossover. The key here is understanding the crossover: the signal line of the stochastic must cross the overbought or oversold line. For example, if the signal line is below the overbought line and then crosses above it, that's your cue. The opposite holds true for the oversold level, where the signal line must dip below the oversold line.
Key Inputs to Consider:
- OverSold Level: Set this to define your oversold threshold.
- OverBought Level: This helps you define when the market is overbought.
- Symbol: Enter a specific symbol name if you prefer not to use the one currently on your chart.
- Timeframe: Choose a timeframe that may differ from the one your chart is based on.


Related Posts
- Unlocking MetaCOT 2: Your Ultimate CFTC Indicator Toolkit for MT4
- Unlocking the Power of Master Tools for MetaTrader 4
- Mastering the Open Range Breakout Indicator for MetaTrader 5
- Discover AllAverages v4.9: The Essential Indicator for MetaTrader 4
- How to Use the Change Chart Symbol Menu for MetaTrader 4