Bollinger Squeeze Basic Indicator for MetaTrader 5 is a powerful tool that traders can leverage to gauge market momentum. This indicator combines the concepts of Momentum, Bollinger Bands, and the Keltner Channel to provide valuable insights into market movements.
The Bollinger Squeeze Basic indicator is presented as a Momentum histogram alongside a series of dots that highlight the relationship between the Bollinger Bands and the Keltner Channel. This versatile indicator is compatible with both MT4 and MT5 platforms, making it accessible for a wide range of traders.
Input Parameters
- MaxBars (default = 300) — sets the maximum number of bars on the chart for indicator application.
- BB_Period (default = 20) — defines the period for the Bollinger Bands calculation.
- BB_Deviation (default = 2.0) — sets the deviation parameter for the Bollinger Bands.
- Keltner_Period (default = 20) — specifies the period for the Keltner Channel.
- Keltner_Factor (default = 1.5) — determines the multiplication factor for the Keltner Channel.
- Momentum_Period (default = 12) — sets the period for the Momentum indicator.
- EnableNativeAlerts (default = false) — when set to true, will use MetaTrader's built-in pop-up alerts for changes in BB/Keltner arrow colors.
- EnableEmailAlerts (default = false) — when set to true, email alerts will be sent for changes in BB/Keltner arrow colors. Ensure your email settings in MetaTrader are configured properly via Tools->Options->Email.
- EnablePushAlerts (default = false) — when set to true, push notifications will be sent to your device for changes in BB/Keltner arrow colors. Configure notifications in MetaTrader via Tools->Options->Notifications.
- TriggerCandle (default = Previous) — specifies which candle to trigger alerts on: Previous for the last closed candle or Current for the ongoing candle.
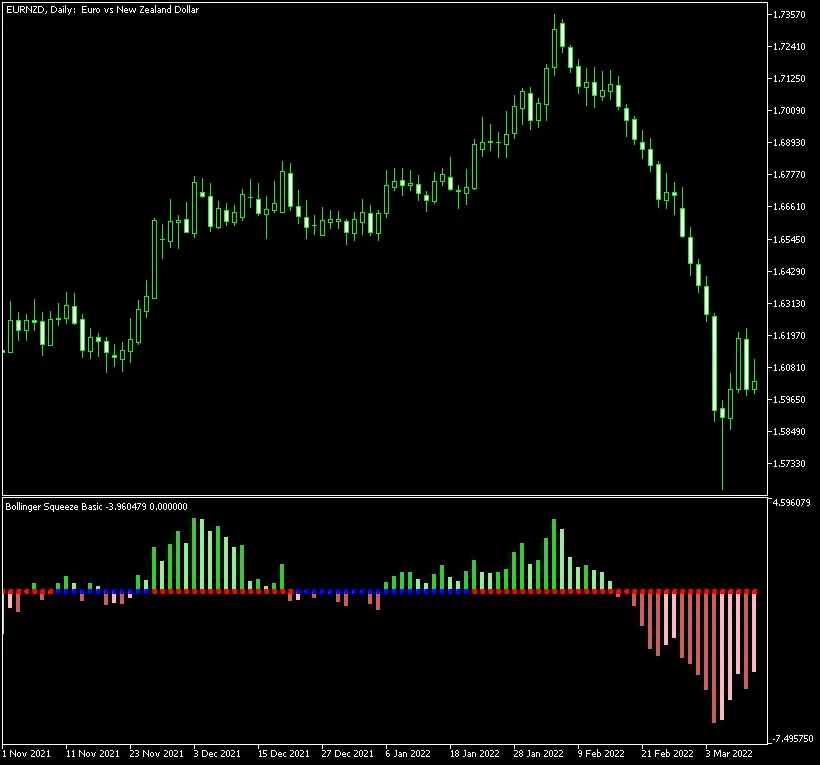
This indicator uses momentum to assess the strength and direction of the trend:
- Rising momentum above the zero line (indicating an uptrend) is shown with darker green bars.
- Falling momentum above the zero line (also an uptrend) displays as lighter green bars.
- Rising momentum below the zero line (indicating a downtrend) is illustrated with darker red bars.
- Falling momentum below the zero line (also a downtrend) is represented with lighter red bars.
Moreover, the Bollinger Squeeze Basic offers an intriguing measure of volatility through its main histogram. The range of blue and red squares on the zero line indicates the relationship between the Bollinger Bands and the Keltner Channel:
- If you see red squares, it means the Bollinger Bands are outside the Keltner Channel, signaling a strong trend.
- If you spot blue squares, it suggests the Bollinger Bands are within the Keltner Channel, indicating a flat or sideways market.
The main takeaway with this indicator is to identify trading ranges during non-trending phases (indicated by blue squares) and prepare for a breakout when the squares shift to red squares (signifying a trending phase). The histogram will guide you on the strength of the current trend and indicate when it's time to exit a trade as the trend starts to weaken.


Comments 0