Hey fellow traders! If you’re looking to get a handle on critical price levels, let me introduce you to the iPulsar indicator—a fantastic tool for MetaTrader 4.
This nifty indicator tracks breakout moments and assesses the importance of those levels. The significance of a level is determined by how long it has remained unbroken in the past. When you see a breakout, it could signal a potential price reversal. Keep your eyes peeled!
One of the best features? It comes with a noise filter and a signal significance filter. These tools help weed out reactions to less important levels and ensure you’re only getting signals that carry substantial new information. No more second-guessing!
Originally developed in 2012 and later enhanced in 2015 at the request of Lesorub, this indicator now includes alerts for those of us who like to monitor multiple price charts simultaneously.
External Variables Explained:
- Scale — This defines how far back the indicator looks, measured in minutes. I usually set this to 1440, which gives me a 24-hour perspective.
- ScaleDigits — This indicates how many decimal places to use on the y-axis. It doesn't alter functionality but helps with clarity.
- LevelFilter — This sets the minimum significance of the levels displayed, measured in Scale periods—think in terms of natural days.
- SignalFilter — This filter lets you specify whether signals should be displayed based on their significance. A value of zero turns off repeated signals.
- SetSignalFilter — A simple toggle to activate the SignalFilter. If set to false, signals are shown without filtering.
How to Use iPulsar:
Let’s look at a practical example. When I launched the indicator on November 27, 2015, with the significance filter turned off and omitting levels with less than 5 trading days of significance, I saw the following:
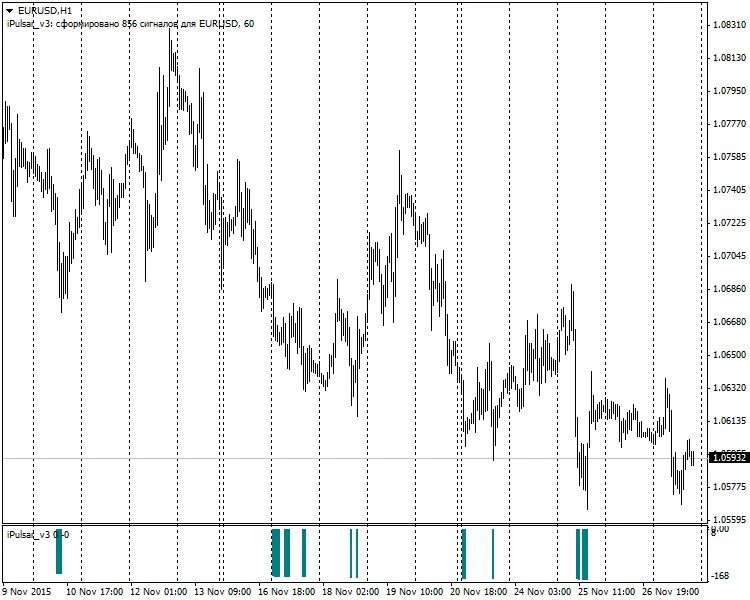
This snapshot shows multiple signals indicating levels of similar significance (140-160 trading days), recognized by the indicator over a short period of just 12 trading days. Essentially, this suggests we might be looking at the same support level. To pinpoint this level more accurately, I used the signal significance filter. By enabling it and setting the value to three trading days, I got:
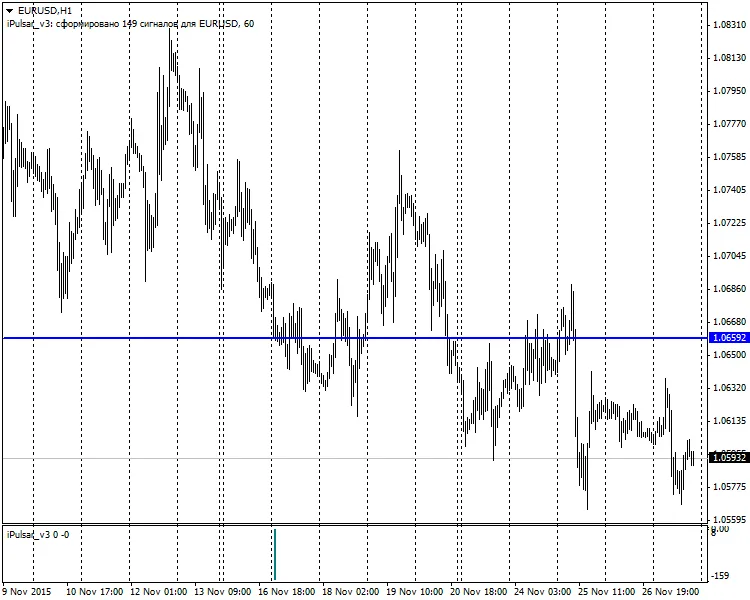
From this, it was clear that the current support level on the EURUSD pair had a significance of 151 trading days, with a value around 1.06592 (highlighted by the blue horizontal line).
Now, to see what was happening in the market 151 trading days before this signal, switch to the D1 timeframe and keep the level on the chart. You won’t need the indicator for this:

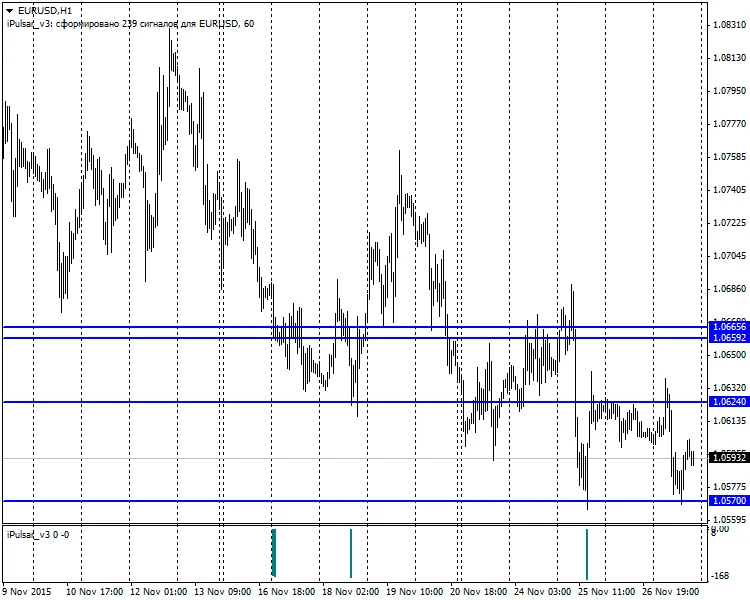
Here, we can observe that the most significant signal does indeed point to a potential reversal level. To identify trading reference points nearby, consider lowering the signal significance to around 16 trading hours, for example. Here’s what that looks like:
Keep in mind that the indicator generates values in real-time and only adjusts on the zero bar, meaning you can confidently use these levels for trading. The trick lies in fine-tuning the filter parameters to suit your strategy.


Comments 0