Welcome to the world of trading, where precision and strategy reign supreme! Today, we're diving into the fantastic PCA Synthetics indicator for MetaTrader 5—a powerful tool that helps you optimize your portfolio by automatically selecting coefficients for every instrument in a pseudo-stationary portfolio.
Before we jump in, make sure you have the AlgLib library installed in the Include\Math folder of your terminal. This is crucial for the indicator to function properly.
A Bit of Theory
Every trading instrument moves in its own unique direction, creating a multidimensional array. By adjusting the matrix—essentially multiplying each element by a specific number—we can identify an axis that minimizes the distance between the axis and all instruments. This process helps us find the least total variance.
The multiplier we use for each matrix element represents the angle value, which tells us how much each instrument should be adjusted to align with the others. If the coefficient value is positive, we buy the currency; if it’s negative, we sell. By recalibrating these coefficients periodically, we maintain the stationarity of our synthetic portfolio.
What's more, PCA doesn’t just find one axis with the least variance—it can identify several! The number of instruments in your portfolio translates into the number of components (or vectors), each referred to as a principal component. These components dictate how much they influence the overall movement of your portfolio.
Possible Problems
- If your chart isn't displaying correctly, check the Experts tab for error messages. There might be synchronization issues with other charts. If you don't see any messages, try switching between different timeframes.
- The vector values generated have been verified against those calculated in the R package, so they are accurate. However, be aware that the sign of a specific coefficient might be incorrect; PCA doesn't consider signs. You'll need to determine the signs empirically through trial and error.
For more insights on potential issues, check out this link.
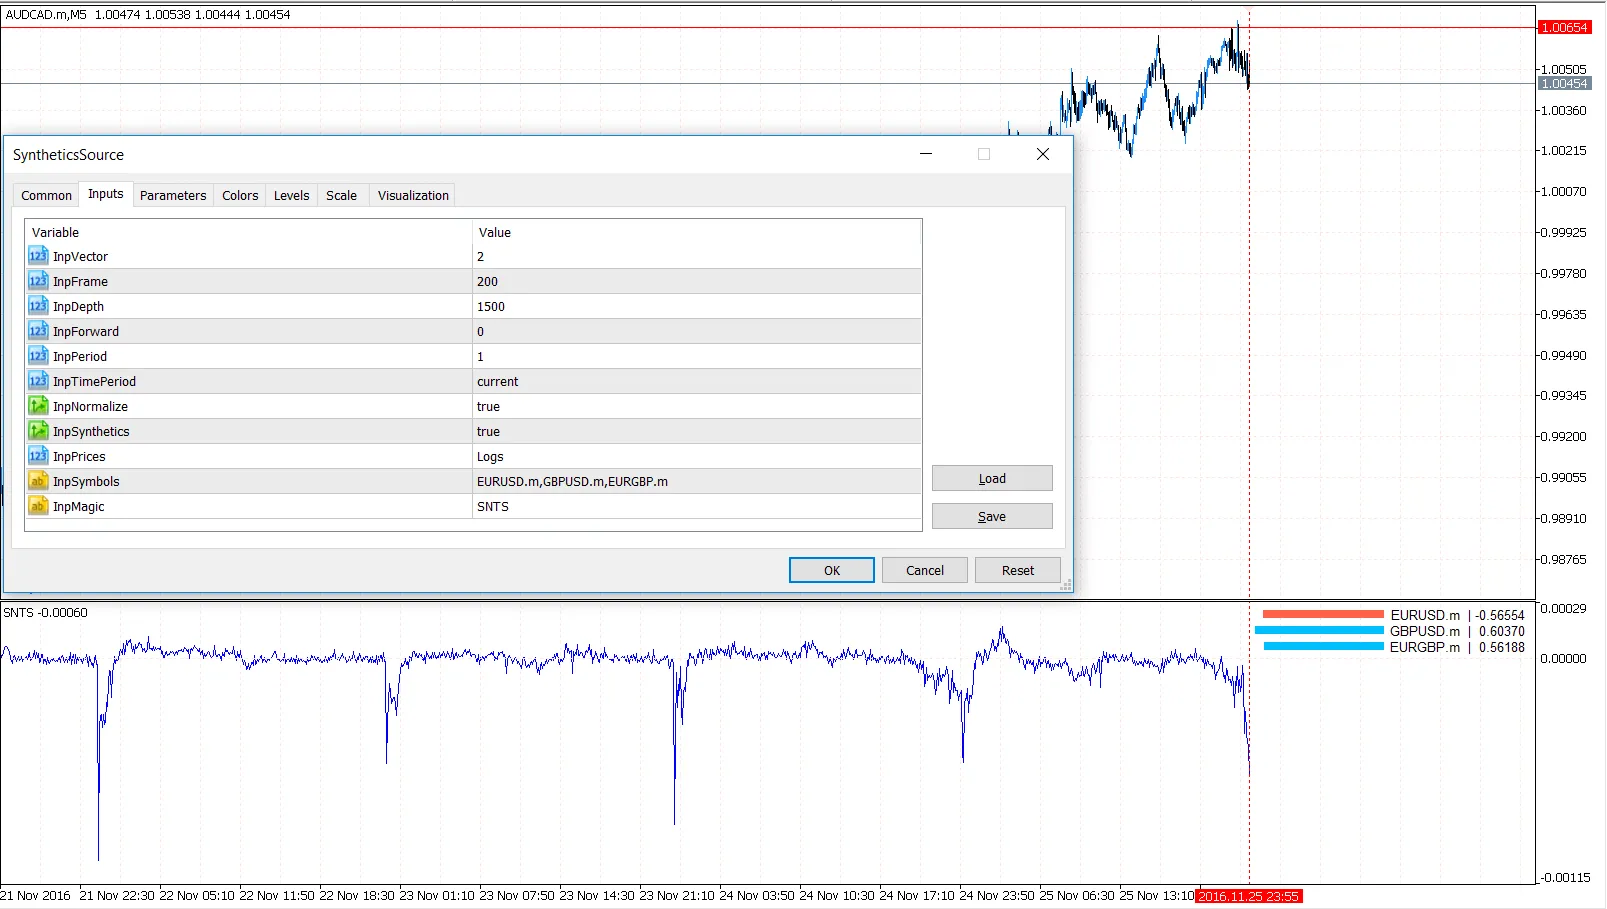
Parameters
InpFrame = 300; // Floating window for coefficient calculations
InpDepth = 1000; // Total number of historical bars for charting
InpForward = 500; // The bar to stop recalculating coefficients
InpPeriod = 1; // Smoothing period for MA
InpTimePeriod = PERIOD_CURRENT; // Timeframe for calculations
InpNormalize = true; // Normalize prices to smooth volatility
InpSynthetics = true; // Draw summary synthetic with coefficients
InpPrices = Logs; // Normalization algorithm for pairs
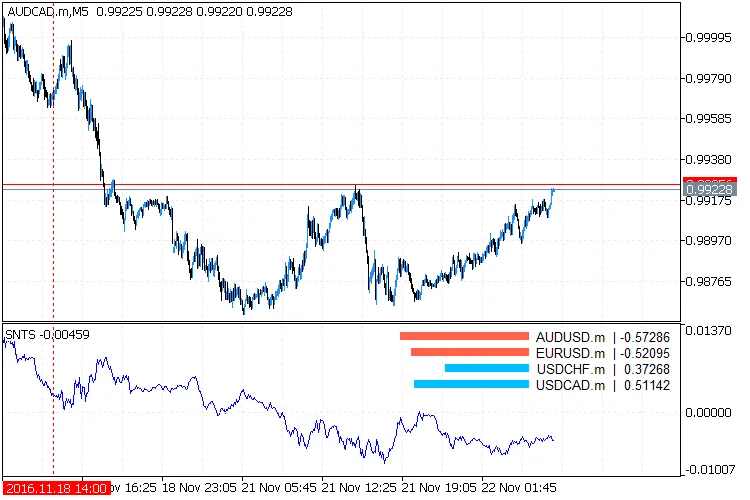
InpSymbols = "AUDUSD,USDCHF,USDCAD"; // Pairs for the portfolio
InpMagic = "ID"; // Custom indicator name for multiple instances
The concept for this guide was inspired from this source.
Visuals


Comments 0