Wave Weis Bar Force: Understanding Accumulated Wave Volume
Wave Weis Bar Force is a powerful indicator designed to utilize the principles of volume waves (Weis) to pinpoint accumulation phases and shifts in market direction. This tool aggregates volume while the trend remains stable, and when the trend shifts, it initiates a new wave and resets the accumulation count to zero. You can monitor the intensity of these movements through the Intensity window, which compares the current wave's volume to the highest recent accumulation.
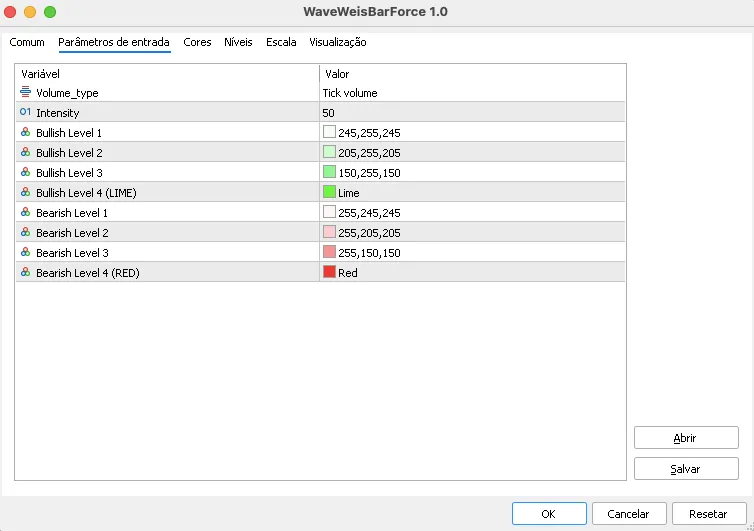
Input Parameters
Volume Type: This setting allows you to choose your volume source—either tick or real volume.
Intensity: This parameter defines the bar window used for intensity reference.
Bullish Levels (1 to 4): A scale of green, ranging from the lightest shade to LIME.
Bearish Levels (1 to 4): A scale of red, from the lightest to RED.
Here's an example of the input parameters screen:
Visual Interpretation
Bullish Levels
Level 1: Very light green (indicating a low intensity wave).
Level 2: Light green.
Level 3: Medium green.
Level 4: LIME (signifying the maximum intensity bullish wave).
Bearish Levels
Level 1: Very light red (indicating a low intensity wave).
Level 2: Light red.
Level 3: Medium red.
Level 4: RED (signifying the maximum intensity bearish wave).
WaveMax (white): This marks the bar representing the highest volume within the current wave.
WaveClimax (yellow): This marks when the current wave's accumulation surpasses the best historical accumulation.
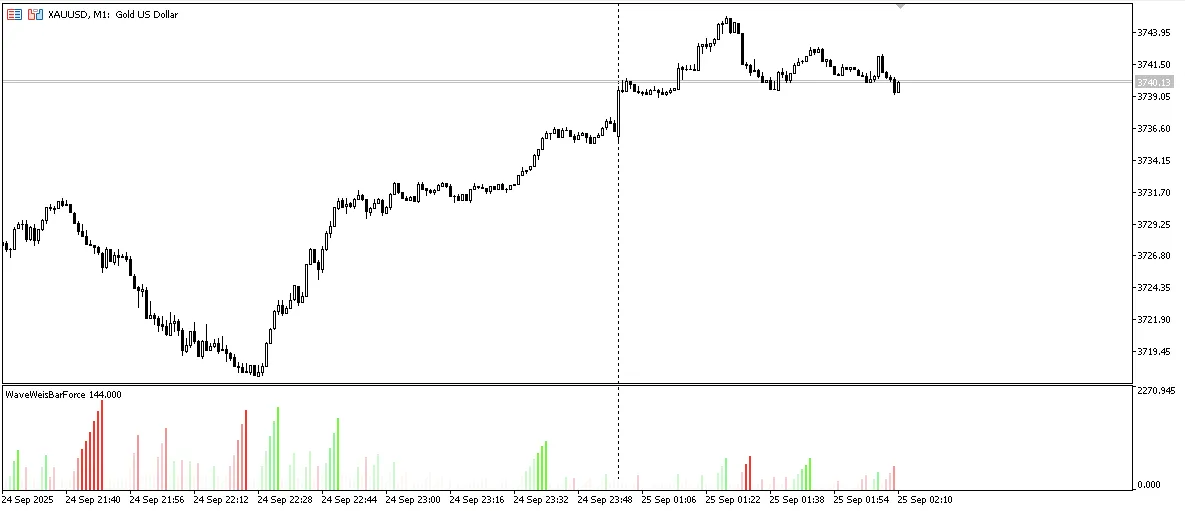
Here's an example of the indicator applied to a chart:
Quick Notes
Only the current cumulative value is shown in the legend for simplicity.
WaveMax and WaveClimax markers are hidden by default to keep the display clean.
This indicator is versatile for any asset and timeframe, making it especially handy for intraday analysis.


Comments 0