Understanding the Basics
Every candlestick on your Forex charts represents a unique set of ticks that contributed to its formation. While we often refer to this as 'Volume' on the charts, it's important to note that it doesn’t directly correlate with actual trading volumes. However, you can use tick volume data similarly to how you would use real volume data.
The tick information utilized by the ClusterBox_Histogram indicator is retrieved from a specialized tick file, which can be generated using the Ticks Collector. Alternatively, you can also access a prepared tick file from the archive. If you don’t need historical rendering, the indicator will provide real-time values as new ticks come in.
What is the ClusterBox_Histogram Indicator?
Unlike the ClusterBox indicator, which shows the number of ticks per cluster within a single candlestick, the ClusterBox_Histogram takes it a step further. It calculates the total ticks for a cluster that encompasses multiple candlesticks. Essentially, it treats a designated set of candlesticks as a single entity, breaking it down into smaller clusters and calculating the tick volume for each one.
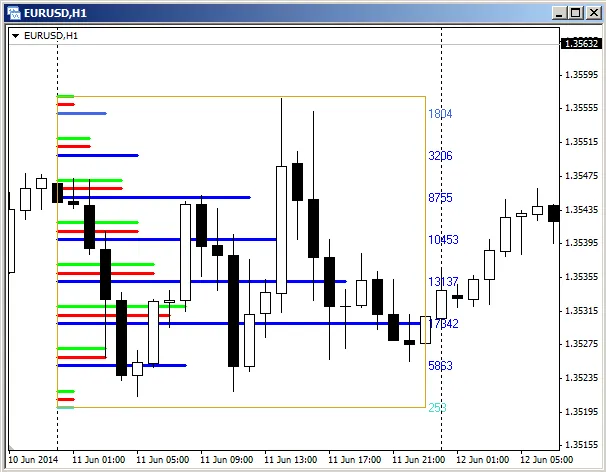
The blue and light blue lines on your chart represent the total ticks for each cluster, with the exact numbers displayed to the right of the rectangle marking the data collection interval. The colors of these lines vary based on the tick count and the settings you’ve configured in the "Min. volumes and colors" section.
The red and green lines indicate the number of ticks for price dips and rises, respectively, as set in the "Delta of volumes" parameters.
To adjust your data collection interval, simply move or drag the rectangle.
For more comprehensive insights, check out the article on The Horizontal Cross-Section of the Market.


Comments 0