Understanding the "False Breakouts" Indicator for MetaTrader 5
Overview
The False Breakouts indicator for MetaTrader 5 is your go-to tool for spotting key trading opportunities. It helps you identify:
- Buy Points and Sell Points based on false breakouts of support and resistance levels.
- Dynamic support and resistance lines.
- Market tops and bottoms.
This indicator efficiently utilizes buffers to display crucial information on your charts, making it a breeze to analyze those tricky false breakout patterns.
Indicator Structure
Key Properties
- Indicator Name: FalseBreakouts
- Version: 1.00
- Display Window: Main chart
Buffers and Plots
This indicator operates using 6 buffers and 6 plots to present data effectively:
- Buy Signal:
- Type: DRAW_ARROW (up arrow).
- Color: Blue.
- Width: 5.
- Sell Signal:
- Type: DRAW_ARROW (down arrow).
- Color: Red.
- Width: 5.
- Support Line:
- Type: DRAW_LINE (solid line).
- Color: Blue.
- Resistance Line:
- Type: DRAW_LINE (solid line).
- Color: Red.
- Top Indicator:
- Type: DRAW_ARROW (up arrow).
- Color: Blue.
- Bottom Indicator:
- Type: DRAW_ARROW (down arrow).
- Color: Red.
Global Variables
- ExtResistancesBuffer[]: Stores resistance levels.
- ExtSupportsBuffer[]: Stores support levels.
- ExtTopsBuffer[]: Stores identified tops.
- ExtBottomsBuffer[]: Stores identified bottoms.
- ExtSellBuffer[]: Stores selling points.
- ExtBuyBuffer[]: Stores buying points.
Main Functions
1. OnInit()
- Purpose: Initializes the indicator and sets up the buffers.
- Actions:
- Maps the buffers to the plots.
- Initializes empty values for the buffers.
- Defines Buy and Sell arrows.
- Sets arrow displacement on the chart.
2. OnCalculate()
- Purpose: Updates buffers with each new tick or candle.
- Actions:
- Checks for any new data.
- Initializes buffers if required.
- Identifies tops and bottoms based on price extremes.
- Updates support, resistance, tops, and bottoms.
- Calls functions to determine Buy and Sell signals.
3. IndexNextPoint()
- Purpose: Finds the index of the next valid point in a buffer.
- Use: Utilized by the IsBuy() and IsSell() functions for reference points.
4. IsBuy()
- Purpose: Checks for a Buy signal based on a false breakout of support.
- Logic:
- Verifies if the current price exceeds the support level.
- Confirms whether a false breakout occurred.
- Returns true if conditions are satisfied.
5. IsSell()
- Purpose: Checks for a Sell signal based on a false breakout of resistance.
- Logic:
- Verifies if the current price is below the resistance level.
- Confirms whether a false breakout occurred.
- Returns true if conditions are met.
Operational Logic
Identifying Tops and Bottoms:
- A top is marked when the current candle's high surpasses the highs of neighboring candles.
- A bottom is marked when the current candle's low dips below the lows of neighboring candles.
Updating Support and Resistance:
- The last identified top is set as resistance.
- The last identified bottom is set as support.
Generating Buy and Sell Signals:
- A buy signal is triggered when the price breaks below support and then rebounds above it.
- A sell signal is triggered when the price breaks above resistance and then falls below it.
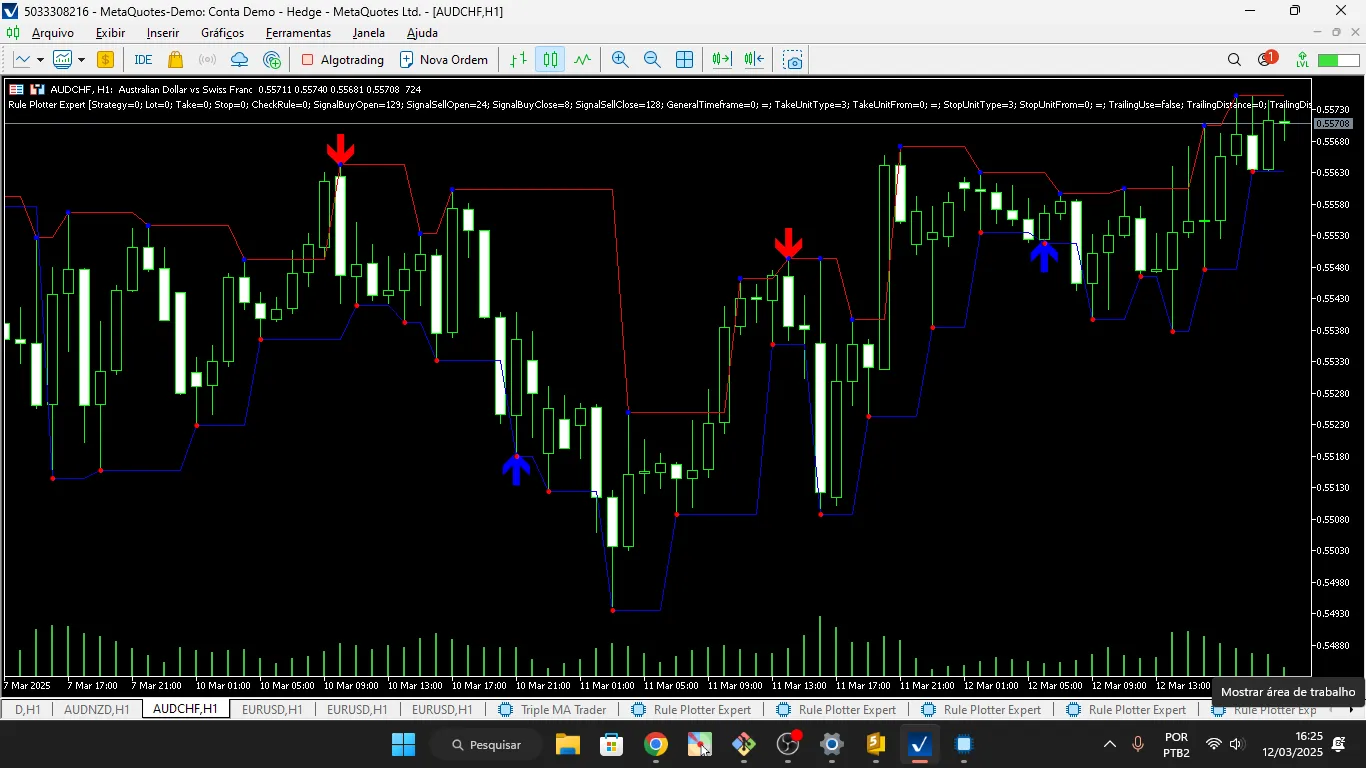
Example of Use
- This indicator can be applied to any chart in MetaTrader 5.
- It will show:
- Blue arrows for Buy points.
- Red arrows for Sell points.
- Blue lines for support levels.
- Red lines for resistance levels.
- Additional arrows indicating tops and bottoms.
Final Thoughts
- This indicator is perfect for traders focused on false breakouts.
- Be sure to test it across various markets and timeframes to gauge its effectiveness.
- You can customize it to include sound alerts or notifications whenever a signal is triggered.


Comments 0