Bollinger Bands (BB) are a powerful tool in the trader's arsenal, often compared to Envelopes. However, the key difference lies in how they are calculated. While Envelopes are set a fixed percentage away from a moving average, Bollinger Bands are based on standard deviations from that same average.
Standard deviation is crucial for measuring volatility, which is why Bollinger Bands adapt to changing market conditions. When the market experiences increased volatility, the bands widen, providing more room for price movement. Conversely, during quieter periods, the bands contract, keeping prices within a tighter range.
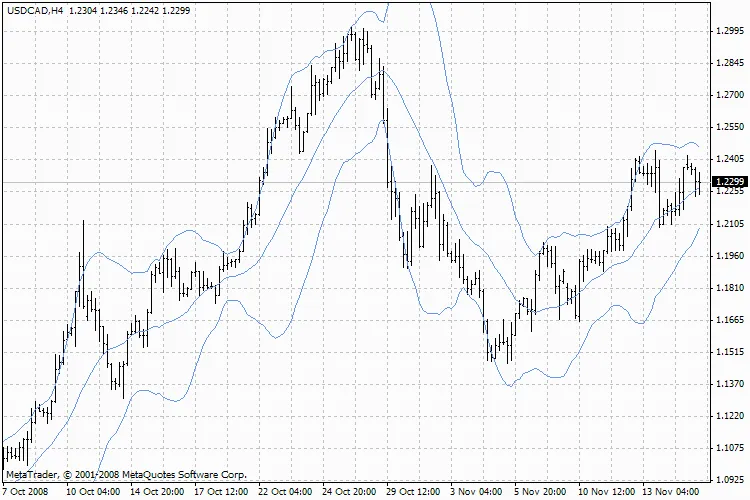
Bollinger Bands, BB
Bollinger Bands are typically overlaid on the price chart but can also be added to an indicator chart. Similar to Envelopes, the interpretation of Bollinger Bands is based on price behavior relative to the upper and lower bands. A defining characteristic of Bollinger Bands is their variable width, which fluctuates based on price volatility. In times of significant price changes, the bands expand, while during stable periods, they contract, narrowing the price range.
Here are some key traits of Bollinger Bands:
- Sudden price changes often follow periods where the bands have contracted due to low volatility.
- If prices break above the upper band, it's typically a signal that the current trend will continue.
- When price peaks and troughs occur outside the bands, followed by movements inside the bands, it may indicate a potential reversal of trend.
- Price movements that start from one band generally tend to reach the opposite band.
This last observation can be particularly useful for predicting potential price targets.
Calculation
Bollinger Bands consist of three lines. The middle line (ML) is a Simple Moving Average (SMA):
ML = SUM(CLOSE, N) / N = SMA(CLOSE, N)
The upper line (TL) is calculated by adding a certain number of standard deviations (D) to the middle line:
TL = ML + (D * StdDev)
Meanwhile, the lower line (BL) is the middle line decreased by the same number of standard deviations:
BL = ML - (D * StdDev)
To find the standard deviation:
StdDev = SQRT(SUM((CLOSE - SMA(CLOSE, N))^2, N) / N)
Where:
- SUM(..., N) — sum for N periods;
- CLOSE — closing price;
- N — number of periods used in the calculation;
- SMA — Simple Moving Average;
- SQRT — square root;
- StdDev — standard deviation;
For optimal results, it's recommended to use a 20-period Simple Moving Average as the middle line, with the upper and lower bands set two standard deviations away from it. Keep in mind that moving averages of less than 10 periods may not yield significant insights.
Further Reading
If you want to dive deeper into the Bollinger Bands, check out the Technical analysis: Bollinger Bands section for a comprehensive overview.


Comments 0