Hey fellow traders! If you've ever found yourself wrestling with the effectiveness of oscillators, you're not alone. I've often needed to normalize their values—essentially squeezing those oscillations into a neat range of [-1;1]. This simple adjustment can open up new avenues for analysis. Instead of trying to gauge values based on rough market estimates, you can control them with specific levels like 0.5 or 0.8. Of course, if your indicator is already normalized, then you're good to go. But if it’s not, I urge you to give this method a shot—just bear with me on the coding side!
Parameters:
string Indicator - This is the indicator you'll pass into the icustom() function. Unfortunately, the MQL4 automation tools aren’t quite up to par when it comes to adding standard indicators. But hey, a curious coder can always tweak things a bit, right?
int mode - This refers to the specific line number of the initial indicator...
int param1
int param2 - These are the additional parameters. Again, MQL developers seem to love their variable parameters (think Print), but let’s roll up our sleeves and tackle this manually.
Picture:
Comments:
The calculations go through two key stages:
- Initialization Stage: In the init() function (for those who might not know), we analyze the entire array of indicator data to find the distinctive period. This is the timeframe within which the mean square value of the indicator can reflect the overall market behavior.
- Let’s break it down: Say we have an oscillator and we’ve computed its mean square over several successive oscillation periods. We’ll agree on using 3 periods (like I do with #define PERIODS_CHARACTERISTIC 3). Going beyond that might overload your processor. The goal is to determine the average length of one period (i.e., 2 times the average interval between two zeros of the indicator) and multiply that by 3.
2. Next, we calculate the mean square value (MSV) for each bar over those three periods—essentially the square root of the variance—to normalize our indicator. Finally, we adjust everything to fit within the dynamic range of [-1;1] using a compressor function, specifically f(x)=tanh(x) (that’s the hyperbolic tangent, and yes, I had to whip up that function myself!).
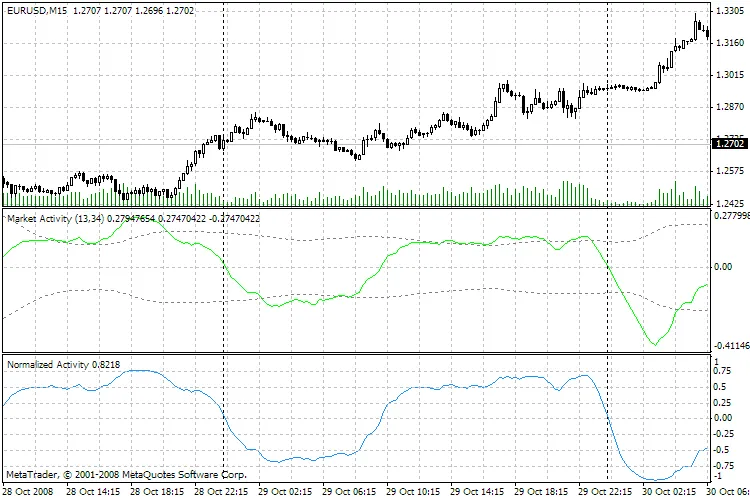
This is a straightforward technical example: The green line in the image represents my trusty old oscillator that tracks market activity (essentially a volume-based version of MACD). The blue line is the same oscillator, but it’s been run through the -Normalizator-. You can easily spot the +-0.75, +-0.5, and +-0.25 levels, along with all the highs, lows, and zero-crossing points maintaining their positions.
So there you have it! Happy trading, and remember, I’m not here to please everyone!


Comments 0