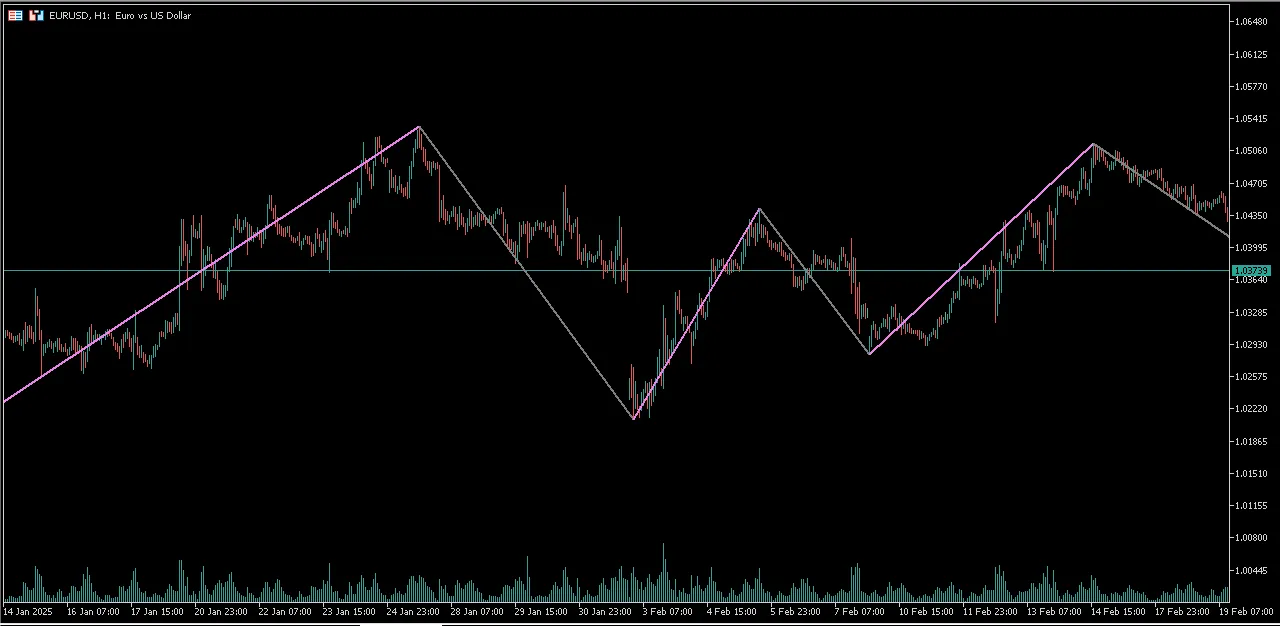
What is the Autoscaling Zigzag Indicator? The Autoscaling Zigzag is a handy tool that helps traders ...
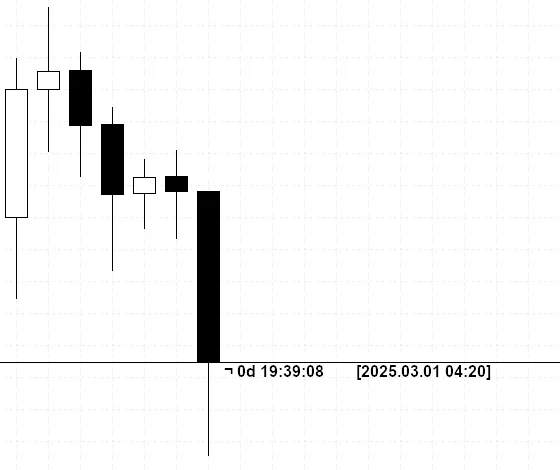
Time To Close MT5 TimeToClose-v1.01 is a must-have chart indicator that provides a real-time countdo...
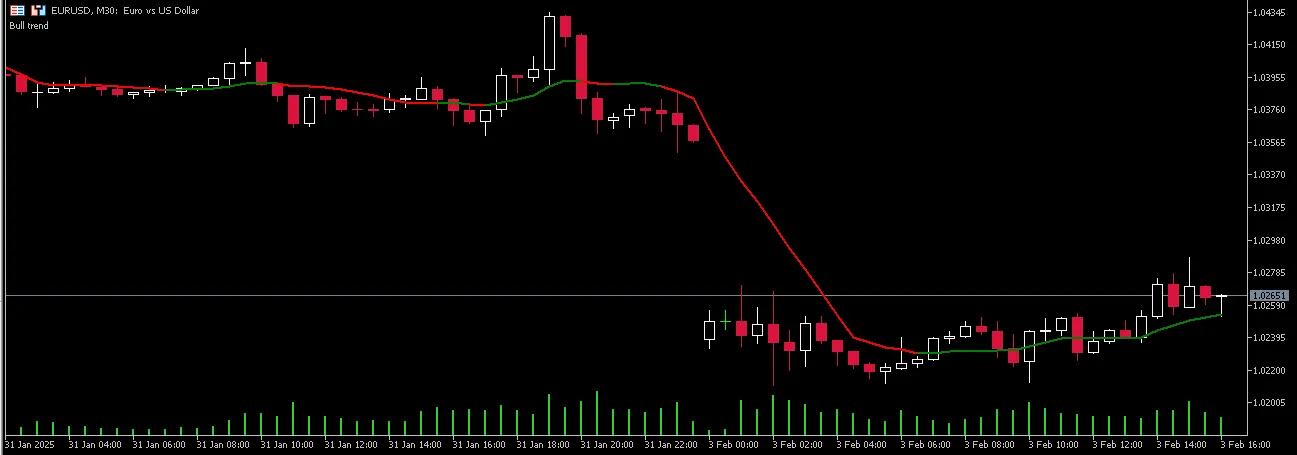
Hey fellow traders! Today, we're diving into a handy tool that can help you keep your finger on the ...
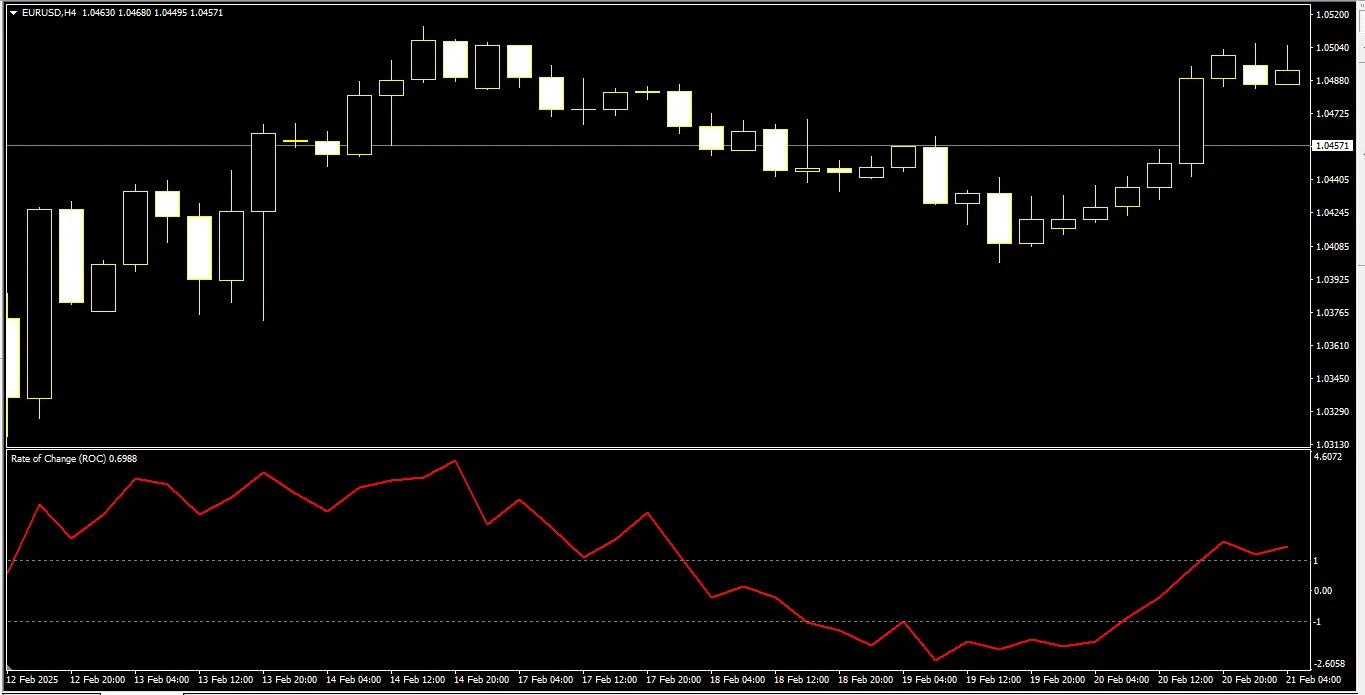
The Algorithm Behind the Indicator This nifty indicator evaluates all Simple Moving Average (SMA) p...
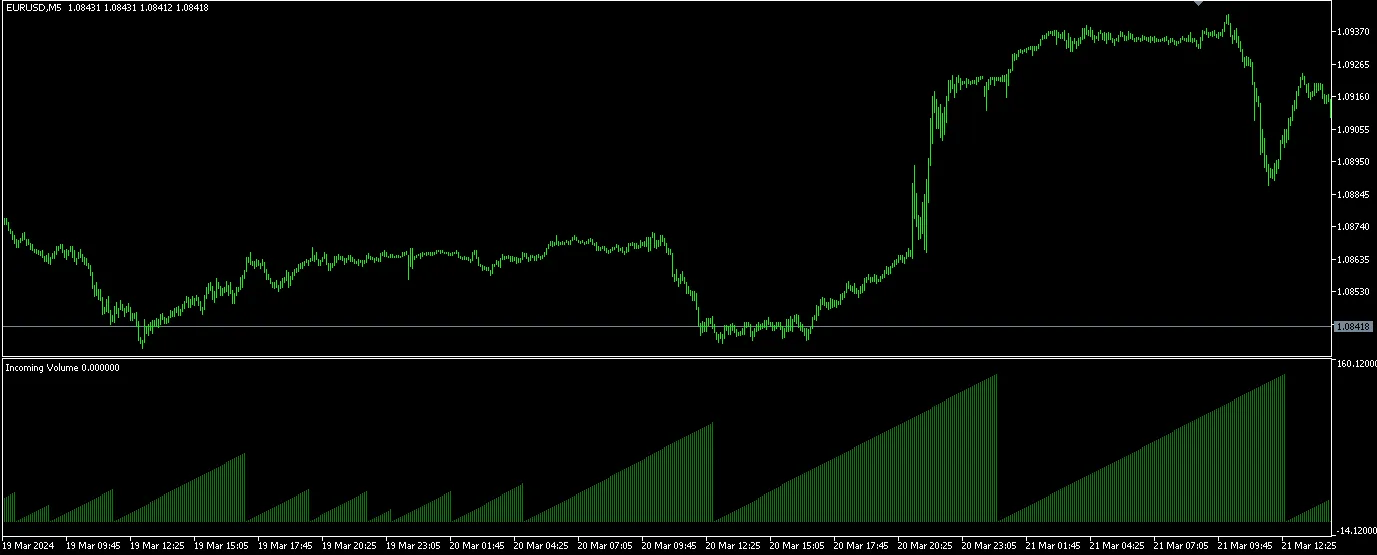
Hey fellow traders! Have you ever wished you could get a clearer picture of volume as it flows in re...
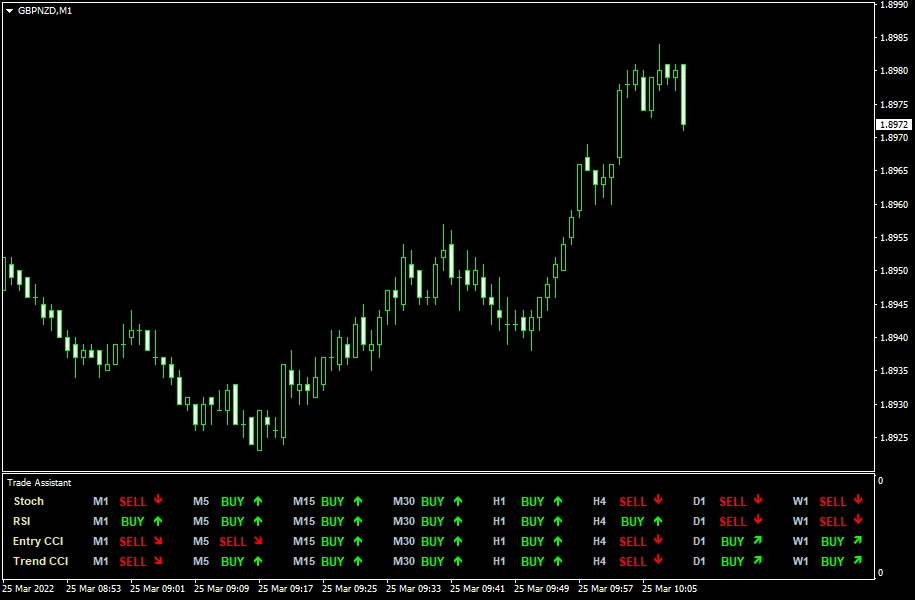
Trade Assistant MT4 Indicator is a powerful multi-timeframe tool designed to enhance your trading ex...
Trade Assistant Indicator for MetaTrader 5 is a powerful multi-timeframe tool that integrates three ...
If you’re diving into the world of trading and looking for a handy tool to streamline your analysis,...
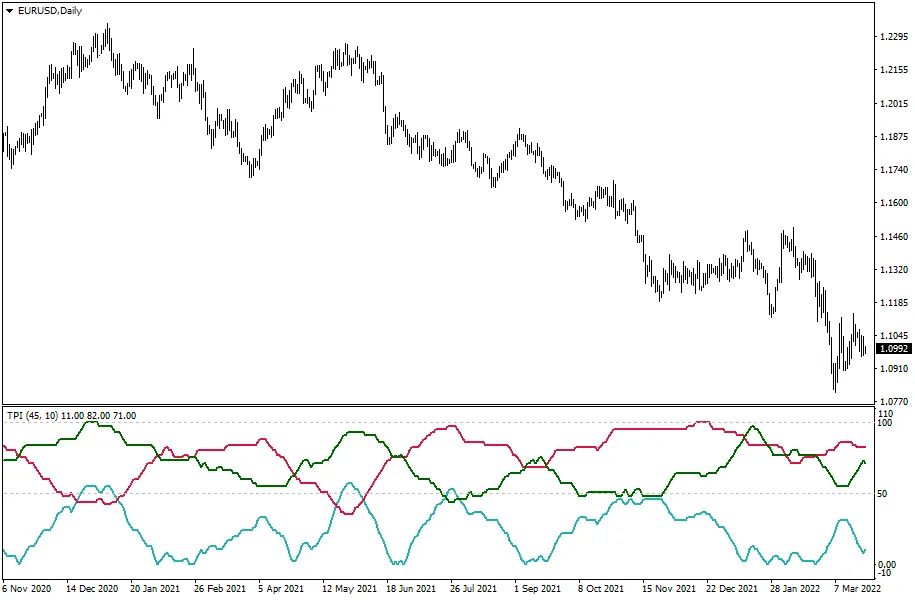
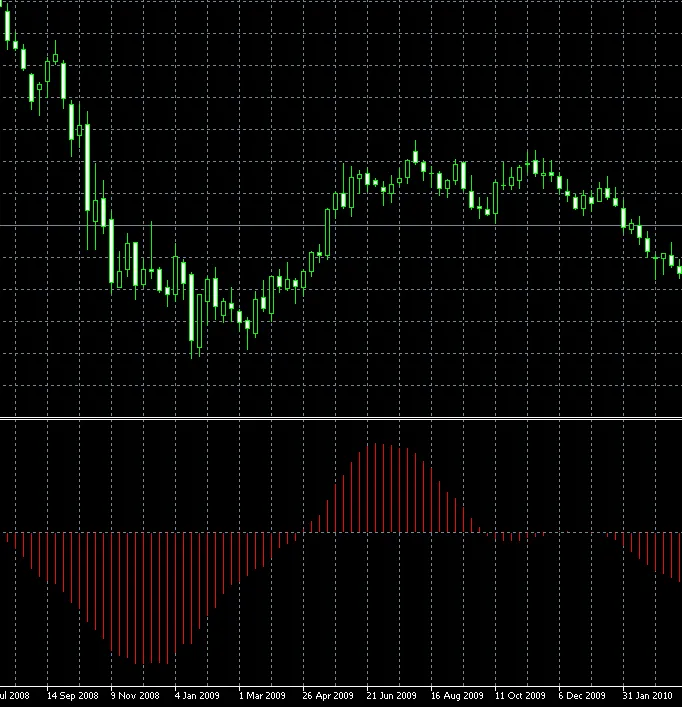
Total Power Indicator (MT4) — This powerful tool is built on two standard indicators: Bear Power and...
Introducing the Total Power Indicator for MetaTrader 5 — a powerful tool built on two classic indica...
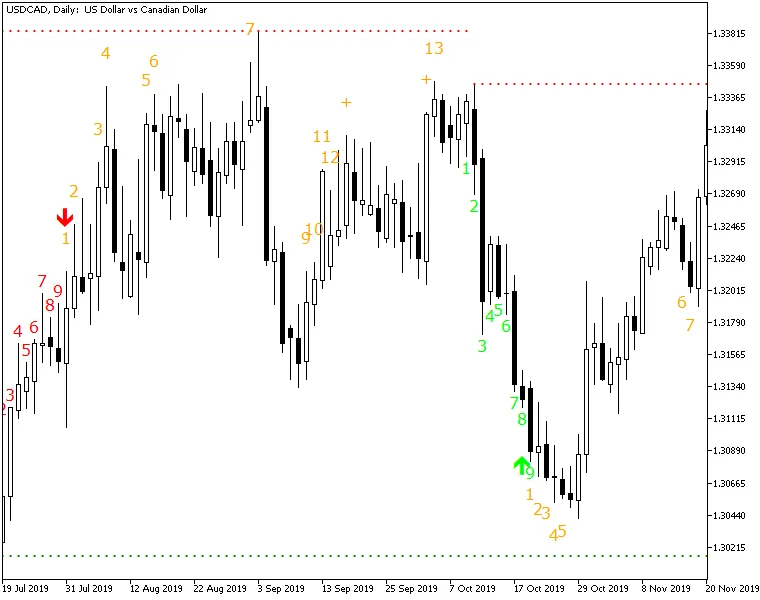
Unlock the Power of the TD Sequential Ultimate Indicator on MetaTrader 4! This nifty tool showcases ...
Discover the Power of TD Sequential Ultimate for MetaTrader 5TD Sequential Ultimate is a game-change...
Understanding the Coppock Indicator for MetaTrader 5 – The Coppock indicator, designed by Edward Cop...
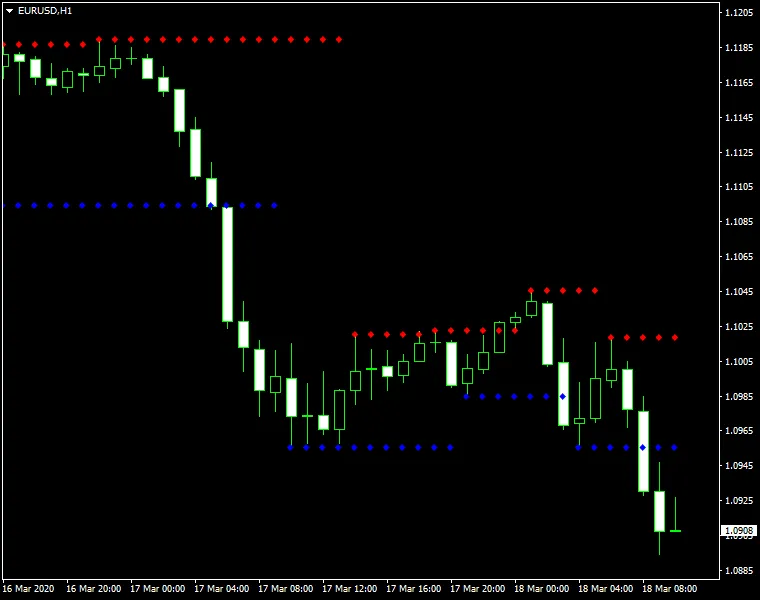
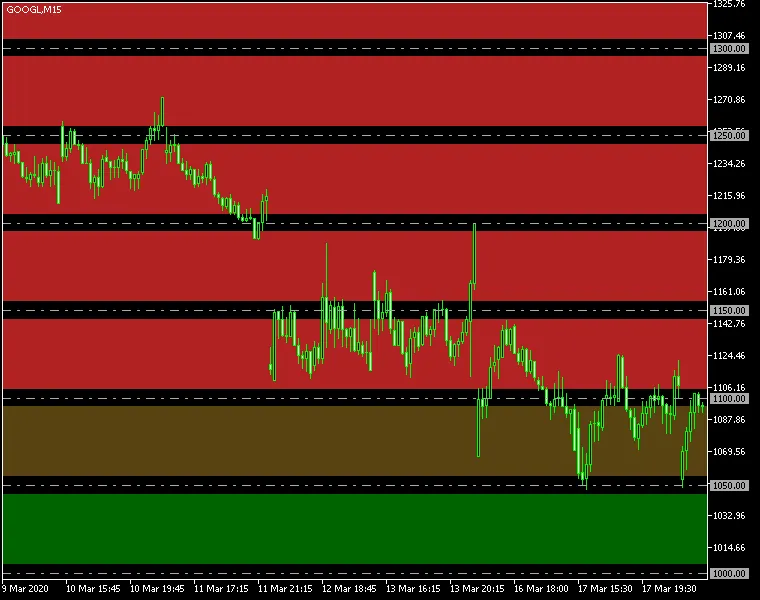
Support and Resistance Indicator for MetaTrader — as the name implies, this handy tool displays crit...
Unlocking the Power of the Support and Resistance Indicator for MetaTrader 5 — As the name implies, ...
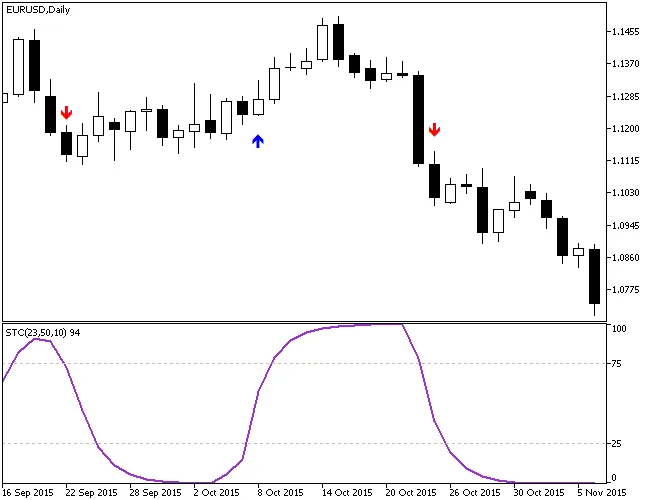
Schaff Trend Cycle Indicator for MetaTrader 4 — This cyclical oscillator is designed to help you nav...
Schaff Trend Cycle (MT5 Indicator) — This unique cyclical oscillator is designed to enhance your tra...
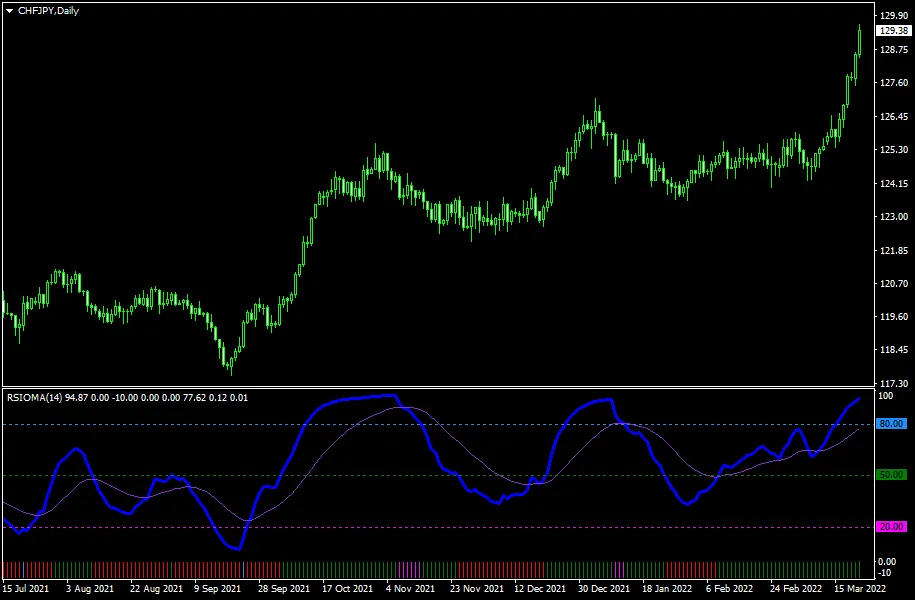
RSIOMA Indicator for MetaTrader 4 — If you're looking to enhance your trading strategy, the RSIOMA i...
Unlock the Power of the RSIOMA Indicator in MetaTrader 5 — The RSIOMA indicator is a nifty tool that...
Round Levels Indicator for MetaTrader 4 – This nifty MT4/MT5 tool allows you to visualize round leve...