Technical Indicator

Unlocking the Donchian Ultimate Indicator for MT5: Your Trading Edge
MetaTrader5
Unlocking the Donchian Ultimate Indicator for MT5: Your Trading Edge

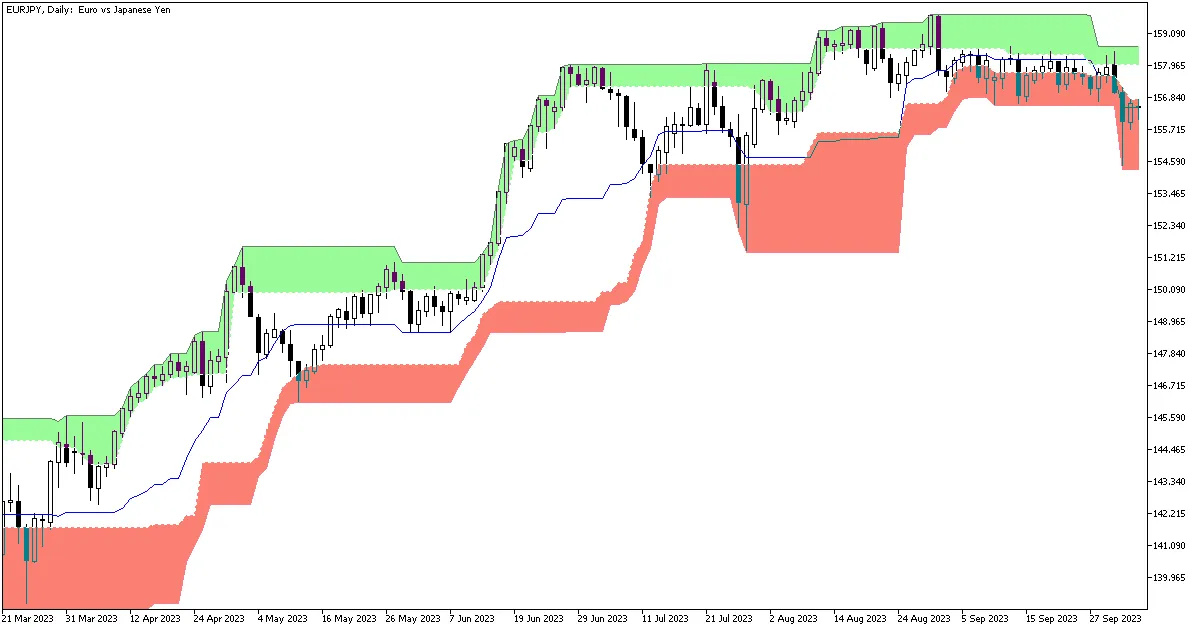
Discover the Donchian Ultimate Indicator for MetaTrader 5—a sophisticated take on the classic Donchian channel that offers a wealth of features to enhance your trading experience. Customizable period and shift settings for the Donchian channel. Option to toggle the middle line on or off. Multi-timeframe (MTF) functionality for dynamic analysis. Five different methods for calculating channel boundaries. Support and resistance zones displayed near the channel borders. A robust alert system to keep you informed. Highly customizable to suit your trading style. This indicator is displayed directly in the main window and operates without relying on any other standard or custom indicators. You can find the Donchian Ultimate available for MT4, MT5, and cTrader platforms. Input Parameters Period (default = 20) — sets the Donchian channel period. Timeframe (default = Current) — determines the timeframe for channel calculation. If you choose a higher timeframe than your current one, it will display that higher timeframe channel on your current chart. Note that this parameter is disregarded if set to a lower timeframe. Price Type (default = Highest High (Lowest Low)) — specifies the price type for calculations. You can choose from five modes: Highest High (Lowest Low) — the classic Donchian configuration where the upper band is calculated from the Highest High and the lower band from the Lowest Low of the period. Average Highest High, Highest Open (Lowest Low, Lowest Open) — averages the Highest High and Highest Open for the upper band, and the Lowest Low and Lowest Open for the lower band. Average Highest High, Highest Close (Lowest Low, Lowest Close) — averages the Highest High and Highest Close for the upper band, and the Lowest Low and Lowest Close for the lower band. Highest Open (Lowest Open) — uses the Highest Open and Lowest Open to set the bands. Highest Close (Lowest Close) — employs the Highest Close and Lowest Close for the band calculations. Shift (default = 0) — sets the number of bars to shift the indicator. Show Resistance Span (default = true) — displays the upper resistance span on the chart if set to true. Show Support Span (default = true) — displays the lower support span on the chart if set to true. Alert Candle (default = Previous) — determines which candle triggers alerts: Previous for the most recent closed candle or Current for the ongoing candle. Alert About Bullish Crossing of Mid Line (default = true) — alerts you when a candle closes above the middle line from below. Alert About Bearish Crossing of Mid Line (default = true) — alerts you when a candle closes below the middle line from above. Alert About Candle Close Inside Resistance (default = true) — notifies you when a candle closes inside the resistance zone. Alert About Candle Close Inside Support (default = true) — alerts you when a candle closes inside the support zone. Show Alert (default = false) — if set to true, it activates MetaTrader’s built-in pop-up alerts. Send Email (default = false) — if set to true, it enables email alerts through MetaTrader, which must be configured under Tools -> Options -> Email. Send Notification (default = false) — if set to true, it allows push notifications via MetaTrader, which should be set up in Tools -> Options -> Notifications. Using the Donchian Ultimate Indicator While the Donchian Ultimate Indicator, like its classic counterpart, doesn’t directly generate buy or sell signals, it provides valuable insight into the current trend and price movements. For instance, when a trend begins, the upper band will consistently rise, while both bands will flatten during price consolidation. Check out the chart below for a visual representation:

2025.01.30
Mastering the Detrended Price Oscillator for MT5 Trading
MetaTrader5
Mastering the Detrended Price Oscillator for MT5 Trading

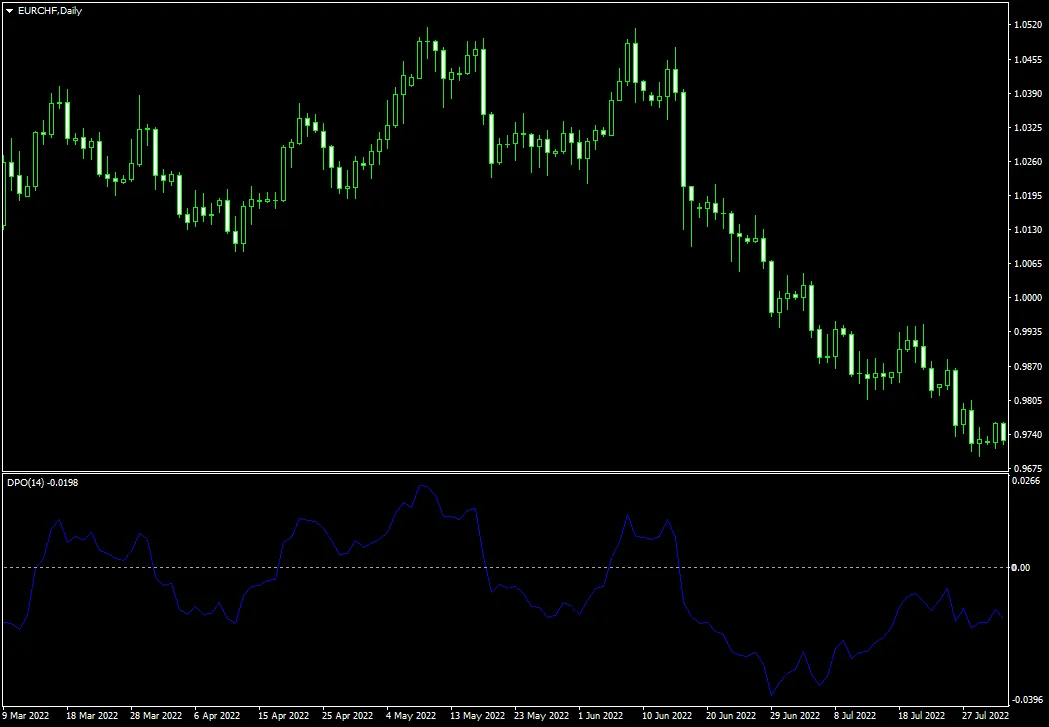
Detrended Price Oscillator (DPO) for MetaTrader 5 — This handy indicator shows the difference between the current price and a simple moving average that's shifted by (Period / 2) + 1 bars. Unlike the stochastic oscillator, the DPO focuses on short-term trend changes, capturing the price waves within the larger trend. You can find it in a separate window on your chart, and it’s available for both MT4 and MT5 platforms. Input Parameters MA_Period (default = 14) — This sets the period for the simple moving average used in the DPO. BarsToCount (default = 400) — This parameter defines how many bars the indicator will calculate. EnableNativeAlerts (default = false) — When set to true, the indicator will use MetaTrader's native pop-up alerts. EnableEmailAlerts (default = false) — If true, the indicator will send email alerts. Make sure your email settings are configured in MetaTrader under Tools -> Options -> Email. EnablePushAlerts (default = false) — When set to true, the indicator will send push notifications. Ensure notifications are set up in MetaTrader under Tools -> Options -> Notifications. TriggerCandle (default = Previous) — This defines the candle for alerts: Previous for the last closed candle or Current for the ongoing candle. Trading Strategy Trend changes are indicated by the DPO crossing the zero level. However, since this indicator tends to lag, predicting these crosses can be more effective. While it may not be the most accurate tool for direct trading, it can still help confirm short-term trends. Another useful application of the Detrended Price Oscillator is spotting divergences with the price chart. As illustrated in the chart below, significant trend reversals can often be detected by comparing the double top pattern on the price chart with the lower high on the DPO chart.

2025.01.30
Mastering Daily Percentage Change in MT5: Your Essential Trading Indicator
MetaTrader5
Mastering Daily Percentage Change in MT5: Your Essential Trading Indicator

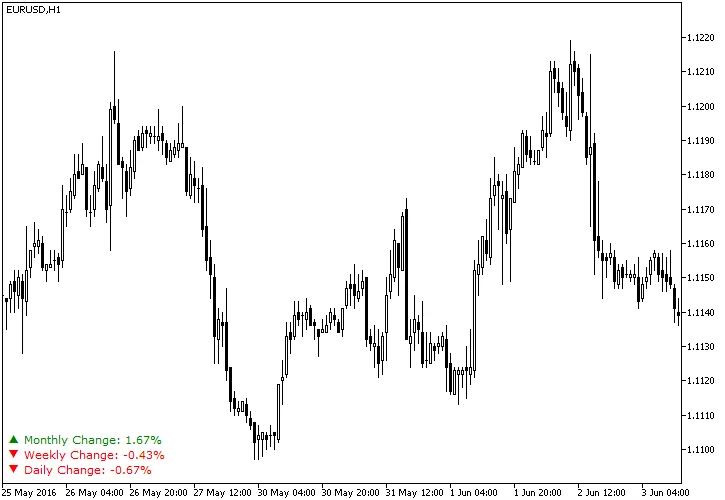
Understanding Daily Percentage Change in MT5 — This handy MetaTrader indicator calculates the change in currency rates compared to the previous daily close, displaying it in percentage points right on your main chart. It doesn't just stop at daily changes; you can also track weekly and monthly percentage shifts. Plus, you can customize colors for positive or negative price movements, making it easier to spot trends at a glance. And for those of you working with brokers that operate in unconventional time zones, the Time Shift feature allows you to adjust the end of the trading day as needed. The good news? This indicator works seamlessly on both MT4 and MT5 platforms. Input Parameters General Settings Time Shift (default = 0) — Adjust this value to shift the effective day's end forward or backward. You can set it anywhere between -12 and 12. Show Weekly (default = true) — Setting this to true will display the weekly percentage change on your chart. Show Monthly (default = true) — If you set this to true, the monthly percentage change will also be shown. Appearance Customization Font Size (default = 8) — This is the size of the text that appears on your chart. Arrow Size (default = 10) — This controls the size of the displayed arrows indicating price changes. Up Color (default = clrGreen) — The text and arrow will appear in this color when the price changes positively. Up Arrow (default = "p") — This is the Windings 3 symbol used for the upward arrow. Down Color (default = clrRed) — The text and arrow will be colored this way when the price change is negative. Down Arrow (default = "q") — The symbol for the downward arrow in Windings 3. No Change Color (default = clrBlue) — The color of the text when the price shows no change. Positioning on the Chart X Distance for Text (default = 21) — This defines how far in pixels the daily change text is positioned from the selected corner of your screen. Y Distance for Text (default = 20) — This controls the vertical distance in pixels from the chosen corner to the daily change text. Text Corner (default = CORNER_LEFT_LOWER) — This is the corner of the chart where the daily change text will be displayed. X Distance for Arrow (default = 5) — This sets the horizontal distance in pixels for the daily change arrow from the selected screen corner. Y Distance for Arrow (default = 20) — This is the vertical distance in pixels from the chosen corner to the daily change arrow. Arrow Corner (default = CORNER_LEFT_LOWER) — This is where the daily change arrow will be positioned on the chart. X Distance for Weekly Text (default = 21) — Horizontal distance for the weekly change text from the chosen corner. Y Distance for Weekly Text (default = 35) — Vertical distance for the weekly change text from the selected corner. Weekly Text Corner (default = CORNER_LEFT_LOWER) — Corner for displaying the weekly change text. X Distance for Weekly Arrow (default = 5) — Horizontal distance from the corner for the weekly change arrow. Y Distance for Weekly Arrow (default = 35) — Vertical distance for the weekly change arrow from the corner. Weekly Arrow Corner (default = CORNER_LEFT_LOWER) — Corner for positioning the weekly change arrow. X Distance for Monthly Text (default = 21) — Horizontal distance from the corner for the monthly change text. Y Distance for Monthly Text (default = 50) — Vertical distance for the monthly change text from the corner. Monthly Text Corner (default = CORNER_LEFT_LOWER) — Corner for displaying the monthly change text. X Distance for Monthly Arrow (default = 5) — Horizontal distance from the corner for the monthly change arrow. Y Distance for Monthly Arrow (default = 50) — Vertical distance for the monthly change arrow from the corner. Monthly Arrow Corner (default = CORNER_LEFT_LOWER) — Corner for positioning the monthly change arrow.

2025.01.30
Mastering the Detrended Price Oscillator for MT4: A Trader's Guide
MetaTrader4
Mastering the Detrended Price Oscillator for MT4: A Trader's Guide

Detrended Price Oscillator (DPO) — This handy MetaTrader indicator helps you spot short-term price movements by comparing the current price to a simple moving average adjusted by (Period / 2) + 1 bars. Unlike the stochastic oscillator, the DPO focuses on pinpointing changes in price trends amidst a longer-term trend. You'll find this indicator displayed in a separate window on your chart, and it's compatible with both MT4 and MT5 platforms. Input Parameters MA_Period (default = 14) — This sets the period for the simple moving average used in the DPO. BarsToCount (default = 400) — This determines how many bars will be included in the calculation of the indicator. EnableNativeAlerts (default = false) — If set to true, the indicator will trigger MetaTrader's native pop-up alerts. EnableEmailAlerts (default = false) — If set to true, the indicator will send email alerts. Make sure your email settings are configured properly in MetaTrader via Tools -> Options -> Email. EnablePushAlerts (default = false) — If set to true, you'll receive push notifications from MetaTrader. Ensure your notifications are set up correctly via Tools -> Options -> Notifications. TriggerCandle (default = Previous) — This specifies which candle will trigger alerts: Previous for the last closed candle or Current for the ongoing candle. Trading Strategy To identify trend shifts, keep an eye on when the DPO crosses the zero level. It's worth noting that this indicator tends to lag, so it might pay off to anticipate these crosses rather than react to them. While it may not be the most precise tool for immediate trading decisions, it can certainly help confirm short-term trends. Another great way to leverage the Detrended Price Oscillator is by spotting divergences between the DPO and the price chart. For instance, you might notice a significant trend reversal by comparing a double top in price with a lower high on the DPO chart, as illustrated in the chart below.

2025.01.30
Mastering Daily Percentage Change in MT4: Your Go-To Indicator
MetaTrader4
Mastering Daily Percentage Change in MT4: Your Go-To Indicator

Daily Percentage Change in MetaTrader 4 is an essential tool for traders looking to track the fluctuations in currency rates relative to the previous daily close. This nifty indicator displays percentage changes directly in your main chart window, giving you instant insight into market trends. Plus, it can show weekly and monthly changes, making it a versatile addition to your trading toolkit. With customizable colors for positive and negative changes, you can easily spot trends at a glance. The indicator also features a small, adjustable arrow to visually indicate the direction of price changes. If your broker operates in a unique time zone, don’t worry! You can adjust the Time Shift setting to ensure your data reflects the correct end of day. This indicator works seamlessly on both MT4 and MT5 platforms. Input Parameters General Settings Time Shift (default = 0) — Adjusts the day's end forward or backward; can be set between -12 and 12. Show Weekly (default = true) — Enables the display of weekly percentage changes on your chart. Show Monthly (default = true) — Enables the display of monthly percentage changes on your chart. Appearance Customization Font Size (default = 8) — Sets the font size for displayed text. Arrow Size (default = 10) — Specifies the size of the displayed arrow. Up Color (default = clrGreen) — Sets the color for positive price changes. Up Arrow (default = "p") — The symbol used for upward price movements. Down Color (default = clrRed) — Sets the color for negative price changes. Down Arrow (default = "q") — The symbol used for downward price movements. No Change Color (default = clrBlue) — Sets the color for text when there's no change in price. Positioning Options X Distance for Text (default = 21) — Horizontal distance in pixels from the chosen screen corner to the daily change text. Y Distance for Text (default = 20) — Vertical distance in pixels from the chosen screen corner to the daily change text. Text Corner (default = CORNER_LEFT_LOWER) — The corner of the chart where the daily change text will be displayed. X Distance for Arrow (default = 5) — Horizontal distance in pixels from the chosen screen corner to the daily change arrow. Y Distance for Arrow (default = 20) — Vertical distance in pixels from the chosen screen corner to the daily change arrow. Arrow Corner (default = CORNER_LEFT_LOWER) — The corner of the chart where the daily change arrow will be displayed. X Distance for Weekly Text (default = 21) — Horizontal distance in pixels from the chosen screen corner to the weekly change text. Y Distance for Weekly Text (default = 35) — Vertical distance in pixels from the chosen screen corner to the weekly change text. Weekly Text Corner (default = CORNER_LEFT_LOWER) — The corner where the weekly change text will be displayed. X Distance for Weekly Arrow (default = 5) — Horizontal distance in pixels from the chosen screen corner to the weekly change arrow. Y Distance for Weekly Arrow (default = 35) — Vertical distance in pixels from the chosen screen corner to the weekly change arrow. Weekly Arrow Corner (default = CORNER_LEFT_LOWER) — The corner for displaying the weekly change arrow. X Distance for Monthly Text (default = 21) — Horizontal distance in pixels from the chosen screen corner to the monthly change text. Y Distance for Monthly Text (default = 50) — Vertical distance in pixels from the chosen screen corner to the monthly change text. Monthly Text Corner (default = CORNER_LEFT_LOWER) — The corner where the monthly change text will be displayed. X Distance for Monthly Arrow (default = 5) — Horizontal distance in pixels from the chosen screen corner to the monthly change arrow. Y Distance for Monthly Arrow (default = 50) — Vertical distance in pixels from the chosen screen corner to the monthly change arrow. Monthly Arrow Corner (default = CORNER_LEFT_LOWER) — The corner for displaying the monthly change arrow.

2025.01.30
Mastering CCI Arrows on MT4: Your Go-To Trading Indicator
MetaTrader4
Mastering CCI Arrows on MT4: Your Go-To Trading Indicator

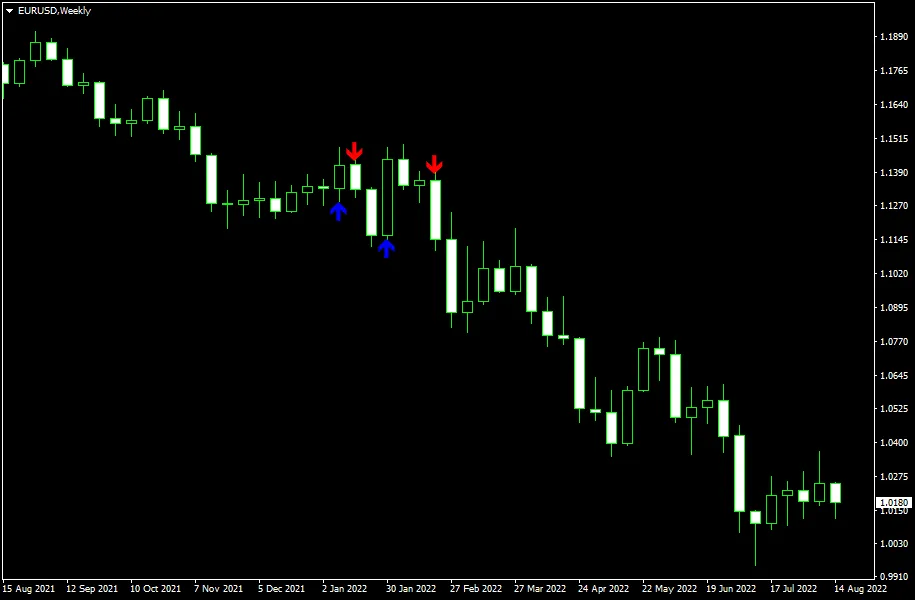
CCI Arrows Indicator for MetaTrader 4 — This handy tool helps you spot where the CCI crosses the zero line, marking it with red or blue arrows. Whether you're thinking of going long or short, this indicator is designed to make your trading decisions easier. With minimal lag and impressive accuracy, it’s a solid choice for traders who prefer to keep things straightforward without the clutter of complicated indicators. Plus, CCI Arrows supports all kinds of alerts and is available for both MT4 and MT5. Input Parameters CCI_Period (default = 14) — This sets the period for the CCI used in the indicator. Keep in mind that a higher value means more lag but fewer false signals. EnableNativeAlerts (default = false) — Set this to true to use MetaTrader's built-in pop-up alerts when an arrow shows up. EnableEmailAlerts (default = false) — Change this to true to receive email alerts from MetaTrader when an arrow appears. Make sure your email settings are configured in MetaTrader via Tools -> Options -> Email. EnablePushAlerts (default = false) — Toggle this to true for push notifications sent to your device whenever an arrow pops up. Don’t forget to set up your notifications in MetaTrader using Tools -> Options -> Notifications. TriggerCandle (default = Previous) — This designates which candle to trigger alerts on: Previous for the last closed candle, or Current for the ongoing one. This indicator provides clear signals for buying (blue arrow pointing up) and selling (red arrow pointing down). A crucial tip: avoid entering a trade if the signal goes against the current trend. For instance, if the trend is upwards and you see a blue arrow, it’s time to go long. If you get a red arrow, just close any open long positions and hold off on new trades. In a downtrend, if a blue arrow appears, close your short position but skip going long; a red arrow means it’s time to short. When the chart is sideways, feel free to act on blue or red arrows accordingly. For added safety, I recommend placing your stop-loss at the level where the arrow appears; you can see this when you hover your mouse over it.

2025.01.30
Mastering CCI Arrows: Your Go-To Indicator for MT5 Trading Success
MetaTrader5
Mastering CCI Arrows: Your Go-To Indicator for MT5 Trading Success

CCI Arrows Indicator for MetaTrader 5 is a powerful tool designed to help you pinpoint when the Commodity Channel Index (CCI) crosses the zero line. It does this by marking these crucial moments with clear red and blue arrows, guiding you in your decisions to go long or short. With minimal lag and impressive accuracy, this straightforward indicator is perfect for traders who prefer a no-nonsense approach over complex systems. Plus, CCI Arrows is compatible with both MT4 and MT5, making it a versatile choice for any trader. Input Parameters CCI_Period (default = 14) — This parameter determines the period of the CCI used in the indicator. A higher value may result in more lag but will provide fewer false signals. EnableNativeAlerts (default = false) — Set this to true to receive MetaTrader's built-in pop-up alerts whenever an arrow appears. EnableEmailAlerts (default = false) — If you want to receive email alerts when an arrow shows up, set this to true. Make sure your email settings are properly configured in MetaTrader under Tools->Options->Email. EnablePushAlerts (default = false) — Turn this to true if you’d like to receive push notifications on your device when an arrow is triggered. Ensure your notifications are set up correctly in MetaTrader via Tools->Options->Notifications. TriggerCandle (default = Previous) — Choose which candle to base alerts on: Previous for the last closed candle or Current for the ongoing one. As illustrated, this indicator provides clear signals for buying (indicated by a blue arrow pointing up) and selling (shown by a red arrow pointing down). However, it’s crucial to remember that you should not enter a trade if the signal contradicts the prevailing trend. For example, in an uptrend, if you see a blue arrow, go long; but if a red arrow appears, do nothing—just close any long positions you have. Conversely, if in a downtrend and you spot a blue arrow, close your short position without going long; if a red arrow shows up, that’s your cue to go short. In a sideways market, feel free to act on either a blue or red arrow.I recommend placing your stop-loss right at the level where the arrow appears, which you can see when you hover your mouse over it. This way, you can protect your capital while still taking advantage of these signals.

2025.01.30
Master Your Trades with the Candle Wicks Length Display Indicator for MT4
MetaTrader4
Master Your Trades with the Candle Wicks Length Display Indicator for MT4

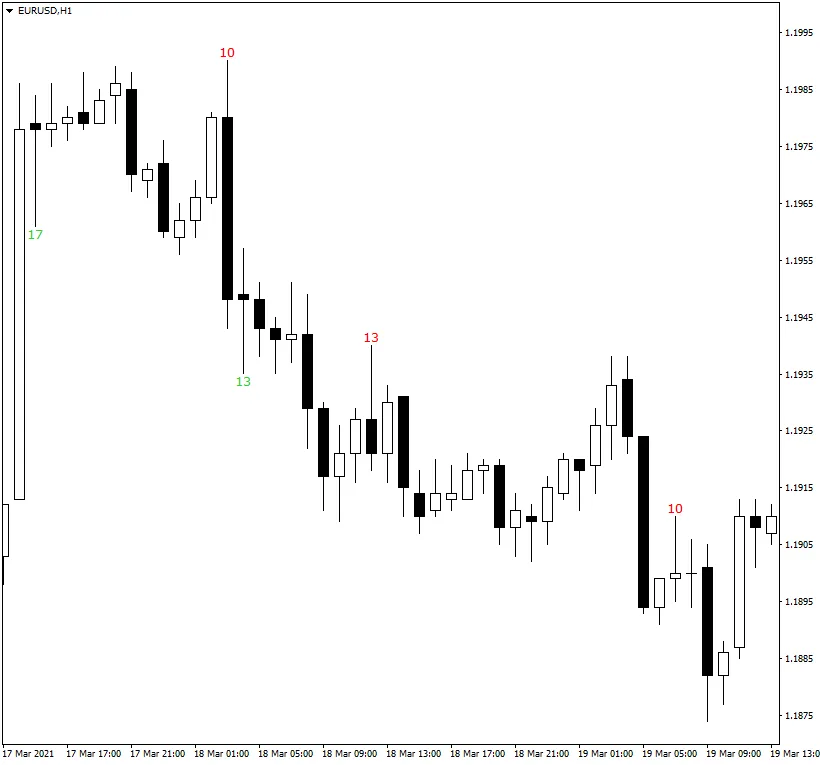
Candle Wicks Length Display Indicator for MetaTrader is a handy tool that shows you the lengths of candle wicks directly on your chart, measured in pips. You can customize it to display only wicks that meet a certain length or even those that fall below a specified limit. This indicator supports alerts and is compatible with both MT4 and MT5 platforms. For those of us who rely on candle wicks to inform our trading decisions, this indicator is a game changer. Whether you're looking for entry or exit signals, the Candle Wicks Length Display can help you stay on top of those crucial long or short wicks and their exact lengths. Input Parameters Units (default = Pips) — Choose how you want to measure the wicks: in standard pips or percentage points. DisplayWickLimit (default = 5) — Set the minimum wick length in pips or percentage points for it to show up on your chart. DisplayHighWickColorBullish (default = clrRed) — Color for the top wick length on bullish candles. DisplayHighWickColorBearish (default = clrFireBrick) — Color for the top wick length on bearish candles. DisplayLowWickColorBullish (default = clrLimeGreen) — Color for the bottom wick length on bullish candles. DisplayLowWickColorBearish (default = clrGreen) — Color for the bottom wick length on bearish candles. UpperWickLimit (default = 10) — Minimum value for the upper wick length to trigger an alert. LowerWickLimit (default = 10) — Minimum value for the lower wick length to trigger an alert. WaitForClose (default = true) — If true, the indicator will wait for a candle to close before checking its wicks' lengths. TopBottomPercent (default = 0) — If set to a value greater than 0 and less than or equal to 100, the indicator will display lengths only for candles where the Open and Close are within the specified percentage. LessThan (default = false) — If true, the indicator will mark wicks that are less than or equal to the given limits instead of greater than or equal. SoundAlert (default = false) — If true, sound alerts will trigger when the UpperWickLimit or LowerWickLimit is reached. VisualAlert (default = false) — If true, pop-up alerts will appear when the UpperWickLimit or LowerWickLimit is reached. EmailAlert (default = false) — If true, email alerts will be sent when the UpperWickLimit or LowerWickLimit is reached. Make sure your email settings are configured in MetaTrader. NotificationAlert (default = false) — If true, push notifications will be sent to your device when the UpperWickLimit or LowerWickLimit is reached. Configure notifications in MetaTrader settings. AlertOnLimit (default = false) — If true, alerts will be issued on wicks exceeding the specified limit. AlertOnEqualTopBottomWicks (default = false) — If true, alerts will be issued when the upper and lower wicks have the same length. IgnoreAlertsOnFirstRun (default = true) — If true, the indicator will ignore alert conditions when first attached to the chart or when the chart's timeframe or symbol is changed. FontFace (default = "Verdana") — The font used for displaying candle wick lengths. FontSize (default = 10) — The size of the font for displaying candle wick lengths. MaxCandles (default = 500) — The number of candles to process from the current one. Set to 0 to process all candles. UseRawPips (default = false) — If true, the indicator uses raw pips instead of calculating pip size for the current symbol, which can be useful for non-Forex symbols. ShowAverageWickSize (default = false) — If true, the average wick size will be displayed. AvgCandles (default = 50) — Number of candles to analyze for calculating the average wick size. Set to 0 to include all available candles. AverageWickSizeColor (default = clrLightGray) — Color of the average wick size display. Corner (default = CORNER_LEFT_UPPER) — The position for displaying the average wick size on the chart. Distance_X (default = 3) — Horizontal distance from the corner to the average wick size display. Distance_Y (default = 12) — Vertical distance from the corner to the average wick size display. DrawTextAsBackground (default = false) — If true, the average wick size label will be drawn as background to avoid obscuring the chart. RemoveOldLabels (default = false) — If true, text labels beyond the number of candles specified by MaxCandles will be continuously removed. ObjectPrefix (default = "CWLD-") — Prefix for chart objects to ensure compatibility with other indicators.

2025.01.30
Maximize Your Trading with the Candle Wicks Length Display Indicator for MT5
MetaTrader5
Maximize Your Trading with the Candle Wicks Length Display Indicator for MT5

Unlock the Power of Candle Wicks with the Candle Wicks Length Display Indicator The Candle Wicks Length Display Indicator for MetaTrader 5 is a game-changer for traders who rely on candle wicks for their trading strategies. This handy tool allows you to view the length of candle wicks directly on your chart in pips, making it easier to spot potential entry and exit points. You can customize it to show only wicks that meet your specific length criteria, ensuring you focus on the signals that matter most. If long wicks are part of your trading strategy, this indicator is a must-have. It helps you stay informed about significant price movements and the precise lengths of those wicks, giving you the edge you need in the market. Key Features of the Candle Wicks Length Display Indicator Units (default = Pips) — Measure wick lengths in standard pips or percentage points. DisplayWickLimit (default = 5) — Set the minimum wick length to display on your chart. DisplayHighWickColorBullish (default = clrRed) — Choose the display color for bullish candle wicks. DisplayHighWickColorBearish (default = clrFireBrick) — Set the color for bearish candle wicks. DisplayLowWickColorBullish (default = clrLimeGreen) — Select the color for the lower wick on bullish candles. DisplayLowWickColorBearish (default = clrGreen) — Customize the color for the lower wick on bearish candles. UpperWickLimit (default = 10) — Minimum upper wick length for alerts. LowerWickLimit (default = 10) — Minimum lower wick length for alerts. WaitForClose (default = true) — Wait for candles to close before measuring wick lengths. TopBottomPercent (default = 0) — Display lengths only for candles where open and close are within a specific percentage. LessThan (default = false) — Mark wicks that are less than or equal to the specified limits. SoundAlert (default = false) — Enable sound alerts when wick limits are reached. VisualAlert (default = false) — Use MetaTrader's pop-up alerts when limits are reached. EmailAlert (default = false) — Get email notifications when limits are breached (requires setup). NotificationAlert (default = false) — Receive push notifications on your device when limits are reached. AlertOnLimit (default = false) — Alerts for wicks exceeding specified limits. AlertOnEqualTopBottomWicks (default = false) — Alerts when upper and lower wicks are of equal length. IgnoreAlertsOnFirstRun (default = true) — Ignore alerts when first attached to the chart. FontFace (default = "Verdana") — Choose the font for wick length display. FontSize (default = 10) — Set the font size for visibility. MaxCandles (default = 500) — Number of candles to process, or set to 0 to process all. UseRawPips (default = false) — Use raw pips instead of calculated values when necessary. ShowAverageWickSize (default = false) — Display the average wick size for better analysis. AvgCandles (default = 50) — Number of candles to analyze for the average wick size. AverageWickSizeColor (default = clrLightGray) — Color of the average wick size display. Corner (default = CORNER_LEFT_UPPER) — Position of the average wick size display on your chart. Distance_X (default = 3) — Horizontal distance from the corner for display. Distance_Y (default = 12) — Vertical distance from the corner for display. DrawTextAsBackground (default = false) — Display the average wick size as background text. RemoveOldLabels (default = false) — Continuously remove text labels beyond the specified limit. ObjectPrefix (default = "CWLD-") — Prefix for chart objects for compatibility.

2025.01.30
Mastering the Bollinger Squeeze: Your Go-To MT4 Indicator for Trend Trading
MetaTrader4
Mastering the Bollinger Squeeze: Your Go-To MT4 Indicator for Trend Trading

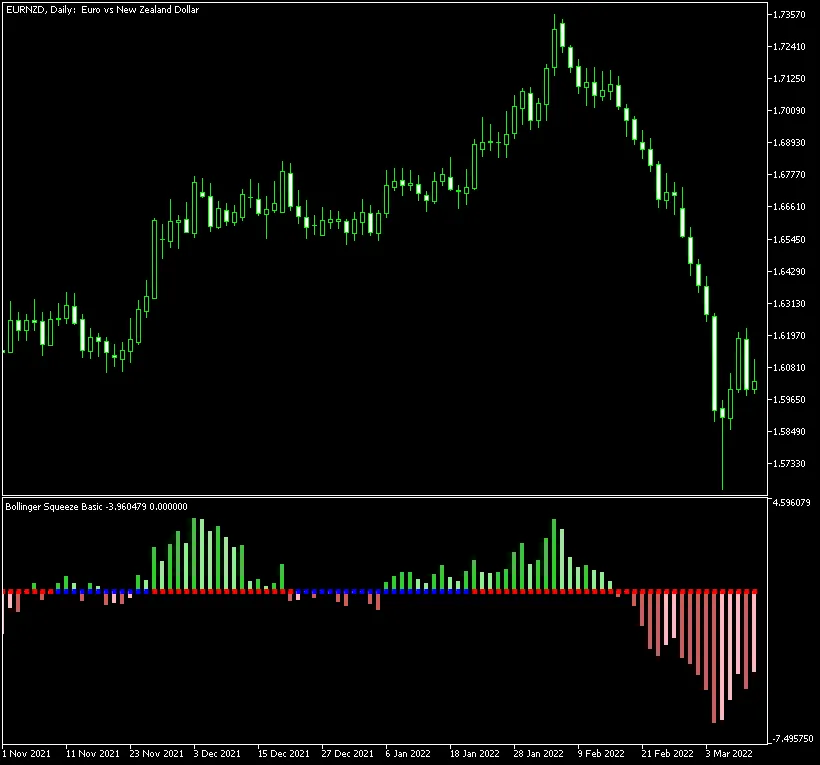
Bollinger Squeeze Basic MetaTrader Indicator is a powerful tool designed for traders who want to harness the dynamics of Momentum, Bollinger Bands, and the Keltner Channel. This indicator operates in a separate window on your chart, providing a Momentum histogram and a series of dots that illustrate the relationship between the current Bollinger Bands and Keltner Channel values. It's compatible with both MT4 and MT5 platforms, making it a versatile choice for traders at any level. Bollinger Squeeze Basic is a key component of the Not So Squeezy indicator system, offering you a unique edge in your trading strategy. Input Parameters MaxBars (default = 300) — the maximum number of bars the indicator will analyze on the chart. BB_Period (default = 20) — the period setting for the Bollinger Bands. BB_Deviation (default = 2.0) — the deviation factor for the Bollinger Bands. Keltner_Period (default = 20) — the period for the Keltner Channel. Keltner_Factor (default = 1.5) — the multiplication factor for the Keltner Channel. Momentum_Period (default = 12) — the period for the Momentum indicator. EnableNativeAlerts (default = false) — if true, you'll receive MetaTrader's native pop-up alerts when the BB/Keltner arrows change color. EnableEmailAlerts (default = false) — if true, email alerts will be sent when the BB/Keltner arrows change color. Make sure your email settings are configured correctly in MetaTrader via Tools -> Options -> Email. EnablePushAlerts (default = false) — if true, push notifications will be sent to your device when the BB/Keltner arrows change color. Ensure notifications are set up in MetaTrader via Tools -> Options -> Notifications. TriggerCandle (default = Previous) — the candle that triggers alerts: Previous for the last closed candle or Current for the ongoing candle. This indicator leverages Momentum to gauge the strength and direction of trends: Rising momentum above the zero line (indicating an uptrend) is shown with darker green bars. Falling momentum above the zero line (still an uptrend) is depicted with lighter green bars. Rising momentum below the zero line (downtrend) is marked with darker red bars. Falling momentum below the zero line (also downtrend) is indicated with lighter red bars. Moreover, the Bollinger Squeeze Basic offers a fascinating measure of volatility directly within the main histogram. The blue and red squares on the zero line reveal the current interaction between the Bollinger Bands and the Keltner Channel: If the squares are red, it suggests that the Bollinger Bands are outside the Keltner Channel, indicating strong market trends. If the squares are blue, it shows that the Bollinger Bands are contained within the Keltner Channel, suggesting a sideways market. The core idea of this indicator is to identify trading ranges during non-trending market phases (represented by blue squares) so you can position yourself for breakouts when the market shifts to a trending phase (indicated by red squares). The histogram not only indicates the current trend's strength but also signals when it's time to exit as the trend weakens.

2025.01.30
Mastering the Bollinger Squeeze Basic Indicator for MT5
MetaTrader5
Mastering the Bollinger Squeeze Basic Indicator for MT5

Bollinger Squeeze Basic Indicator for MetaTrader 5 is a powerful tool that traders can leverage to gauge market momentum. This indicator combines the concepts of Momentum, Bollinger Bands, and the Keltner Channel to provide valuable insights into market movements. The Bollinger Squeeze Basic indicator is presented as a Momentum histogram alongside a series of dots that highlight the relationship between the Bollinger Bands and the Keltner Channel. This versatile indicator is compatible with both MT4 and MT5 platforms, making it accessible for a wide range of traders. Input Parameters MaxBars (default = 300) — sets the maximum number of bars on the chart for indicator application. BB_Period (default = 20) — defines the period for the Bollinger Bands calculation. BB_Deviation (default = 2.0) — sets the deviation parameter for the Bollinger Bands. Keltner_Period (default = 20) — specifies the period for the Keltner Channel. Keltner_Factor (default = 1.5) — determines the multiplication factor for the Keltner Channel. Momentum_Period (default = 12) — sets the period for the Momentum indicator. EnableNativeAlerts (default = false) — when set to true, will use MetaTrader's built-in pop-up alerts for changes in BB/Keltner arrow colors. EnableEmailAlerts (default = false) — when set to true, email alerts will be sent for changes in BB/Keltner arrow colors. Ensure your email settings in MetaTrader are configured properly via Tools->Options->Email. EnablePushAlerts (default = false) — when set to true, push notifications will be sent to your device for changes in BB/Keltner arrow colors. Configure notifications in MetaTrader via Tools->Options->Notifications. TriggerCandle (default = Previous) — specifies which candle to trigger alerts on: Previous for the last closed candle or Current for the ongoing candle. This indicator uses momentum to assess the strength and direction of the trend: Rising momentum above the zero line (indicating an uptrend) is shown with darker green bars. Falling momentum above the zero line (also an uptrend) displays as lighter green bars. Rising momentum below the zero line (indicating a downtrend) is illustrated with darker red bars. Falling momentum below the zero line (also a downtrend) is represented with lighter red bars. Moreover, the Bollinger Squeeze Basic offers an intriguing measure of volatility through its main histogram. The range of blue and red squares on the zero line indicates the relationship between the Bollinger Bands and the Keltner Channel: If you see red squares, it means the Bollinger Bands are outside the Keltner Channel, signaling a strong trend. If you spot blue squares, it suggests the Bollinger Bands are within the Keltner Channel, indicating a flat or sideways market. The main takeaway with this indicator is to identify trading ranges during non-trending phases (indicated by blue squares) and prepare for a breakout when the squares shift to red squares (signifying a trending phase). The histogram will guide you on the strength of the current trend and indicate when it's time to exit a trade as the trend starts to weaken.

2025.01.30
Mastering the Bollinger Squeeze Advanced Indicator for MT4 Trading
MetaTrader4
Mastering the Bollinger Squeeze Advanced Indicator for MT4 Trading

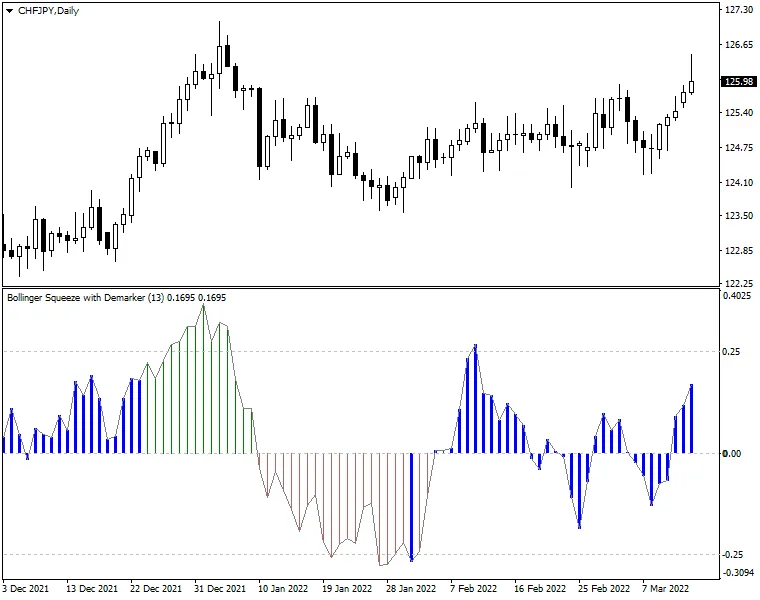
Get to Know the Bollinger Squeeze Advanced Indicator for MetaTrader 4 — this powerful tool is a must-have for any serious trader. It combines two key elements: A measure of trending strength derived from both Bollinger Bands and the Keltner Channel 'squeeze'. A histogram that indicates the trend direction and strength using one of eight oscillators: Stochastic, CCI, RSI, MACD, Momentum, Williams % Range, ADX, or DeMarker. This indicator appears in a separate window on your chart as a histogram. The color and width of its bars provide additional insights into market conditions. Plus, it supports multi-timeframe (MTF) functionality and comes with all sorts of alerts. You can use it on both the MT4 and MT5 versions of the trading platform. The Bollinger Squeeze Advanced is part of the Not So Squeezy Indicator System. Input Parameters Timeframe (default = Current) — Choose the timeframe you want to draw data from. This indicator can display higher timeframe data on a lower timeframe chart. Trigger Type (default = DeMarker) — The oscillator you want to use for the trend measurement histogram. Stochastic Period (default = 14) — The period setting for the Stochastic indicator, if selected via Trigger Type. CCI Period (default = 50) — The period for the CCI indicator when chosen through Trigger Type. RSI Period (default = 14) — The period for the RSI indicator, set via Trigger Type. MACD Fast EMA Period (default = 12) — The fast EMA period for the MACD indicator, if selected through Trigger Type. MACD Slow EMA Period (default = 26) — The slow EMA period for the MACD indicator. MACD Signal Line Period (default = 9) — The signal line period for MACD. Momentum Period (default = 14) — The period for the Momentum indicator, if chosen through Trigger Type. Williams % Range Period (default = 24) — The period for the Williams % Range indicator. ADX Period (default = 14) — The period for the ADX indicator. DeMarker Period (default = 13) — The period for the DeMarker indicator. Alert on Sideways Trending (default = false) — If true, you’ll get alerts when the market shifts from Trending to Sideways or the other way around. Alert on Zero Cross (default = false) — If true, you’ll receive alerts when the histogram crosses the zero line or defined levels. Alert Above Level (default = 0) — Set an alert level for when the indicator's value rises above it. Alert Below Level (default = 0) — An alert level for when the indicator's value dips below it. Enable Native Alerts (default = false) — If true, the indicator will use MetaTrader's built-in pop-up alerts. Enable Email Alerts (default = false) — If true, the indicator will send alerts via email (ensure your MetaTrader email settings are configured in Tools -> Options -> Email). Enable Push Alerts (default = false) — If true, you’ll receive push notifications (check your settings in Tools -> Options -> Notifications). Trigger Candle (default = Previous) — Choose the candle to issue alerts on: Previous for the most recently closed candle or Current for the unfinished candle. The indicator uses one of the eight oscillators to assess the trend's strength and direction, displaying this as a histogram: Green bars above the zero line indicate uptrends. Red bars below the zero line signal downtrends. Moreover, the Bollinger Squeeze Advanced offers a built-in measure of volatility within the main histogram. When the Bollinger Squeeze indicates a sideways market (i.e., when the Bollinger Bands are enclosed within the Keltner Channel), you'll see the histogram bars switch to thick blue. The key takeaway with this indicator is to identify trading ranges during non-trending market phases (marked by blue histogram bars) and to position yourself for breakouts when the bars revert to normal. The histogram will give you a sense of the trend's strength and signal when it’s time to exit as the trend starts to weaken.

2025.01.30
Mastering the Bollinger Squeeze Advanced Indicator for MetaTrader 5
MetaTrader5
Mastering the Bollinger Squeeze Advanced Indicator for MetaTrader 5

Bollinger Squeeze Advanced Indicator for MetaTrader 5 is a powerful tool designed to help traders identify market trends and volatility. This indicator combines two main components: A measure of trendiness based on the Bollinger Bands and the Keltner Channel "squeeze". A histogram that indicates trend direction and strength, utilizing one of eight oscillators: Stochastic, CCI, RSI, MACD, Momentum, Williams % Range, ADX, or DeMarker. The histogram is displayed in a separate window on your chart, with bar colors and widths providing additional insights. It supports multi-timeframe (MTF) functionality and includes various alert options. This indicator is compatible with both MT4 and MT5 versions of the trading platform. Bollinger Squeeze Advanced is part of the Not So Squeezy indicator system, enhancing your trading toolkit. Input Parameters Timeframe (default = Current) — Choose the timeframe for data display. This indicator can show higher timeframe data even on a lower timeframe chart. TriggerType (default = DeMarker) — Select the oscillator for the trend measurement histogram. StochasticPeriod (default = 14) — Set the period for the Stochastic indicator (if selected via TriggerType). CCIPeriod (default = 50) — Set the period for the CCI indicator (if selected via TriggerType). RSIPeriod (default = 14) — Set the period for the RSI indicator (if selected via TriggerType). MACDFastEMAPeriod (default = 12) — Define the fast EMA period for the MACD indicator (if selected via TriggerType). MACDSlowEMAPeriod (default = 26) — Define the slow EMA period for the MACD indicator (if selected via TriggerType). MACDMACDEMAPeriod (default = 9) — Set the signal line period for the MACD indicator (if selected via TriggerType). MomentumPeriod (default = 14) — Set the period for the Momentum indicator (if selected via TriggerType). WilliamsPRPeriod (default = 24) — Set the period for the Williams % Range indicator (if selected via TriggerType). ADXPeriod (default = 14) — Set the period for the ADX indicator (if selected via TriggerType). DeMarkerPeriod (default = 13) — Set the period for the DeMarker indicator (if selected via TriggerType). AlertOnSidewaysTrending (default = false) — If true, the indicator will send alerts when the market shifts from Trending to Sideways and vice versa. AlertOnZeroCross (default = false) — If true, alerts will be triggered when the histogram crosses the zero line or defined levels. AlertAboveLevel (default = 0) — Set an alert level when the indicator's value rises above this threshold. AlertBelowLevel (default = 0) — Set an alert level when the indicator's value falls below this threshold. EnableNativeAlerts (default = false) — If true, the indicator will utilize MetaTrader's native pop-up alerts. EnableEmailAlerts (default = false) — If true, the indicator can send email alerts. Ensure that your MetaTrader is configured correctly via Tools -> Options -> Email. EnablePushAlerts (default = false) — If true, the indicator will send push notifications. Configure these settings in MetaTrader via Tools -> Options -> Notifications. TriggerCandle (default = Previous) — Choose the candle for alerts: Previous for the last closed candle or Current for the ongoing candle. This indicator leverages one of the eight oscillators to gauge the strength and direction of trends, presenting it as a histogram: Green bars above the zero line indicate upward trends. Red bars below the zero line signify downward trends. Moreover, the Bollinger Squeeze Advanced includes a built-in measure of volatility. When the Bollinger Squeeze suggests a sideways market (Bollinger Bands are within the Keltner Channel), the histogram bars turn into thick blue bars. The core idea behind this indicator is to identify trading ranges during non-trending market phases (indicated by blue histogram bars) to capture breakouts when the bars switch back to normal. The histogram not only helps you assess the current trend's strength but also signals when it's time to exit a trade as the trend shows signs of weakening.

2025.01.30
Mastering the BMA Indicator on MT5: Your Guide to Band Moving Averages
MetaTrader5
Mastering the BMA Indicator on MT5: Your Guide to Band Moving Averages

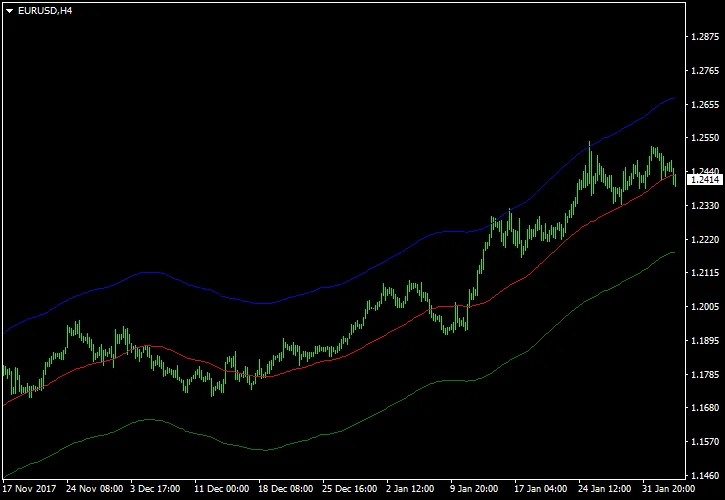
Introducing the BMA Indicator for MetaTrader 5 — the Band Moving Average, crafted from the classic moving average indicator and inspired by community feedback. This handy tool showcases three dynamic lines on your chart: the central line represents the standard moving average (which you can set as simple, exponential, or weighted), while the upper and lower lines are offset by 2% from the central line by default. These additional lines act as key support and resistance levels, helping you make informed trading decisions. You can find this indicator available for both MT4 and MT5 platforms. Input Parameters MA_Period (default = 49): This determines the period for the central moving average line. MA_Shift (default = 0): This allows you to apply a horizontal shift to all lines on your chart. MA_Method (default = Simple): Choose how you want your moving average to be calculated. Percentage (default = 2): This sets the percentage to vertically adjust the upper and lower bands in relation to the central line. For optimal results, try applying this indicator to the EUR/USD H4 chart (as illustrated above). A common strategy is to sell when the price reaches the upper band and to buy when it hits the lower band. Just a heads-up: it’s wise to set a moderate stop-loss level in both scenarios, as prices can occasionally break through these levels or the lines might change direction unexpectedly.

2025.01.30
Beginner's Guide to the MT4 Indicator: Local Tops and Bottoms Made Easy
MetaTrader4
Beginner's Guide to the MT4 Indicator: Local Tops and Bottoms Made Easy

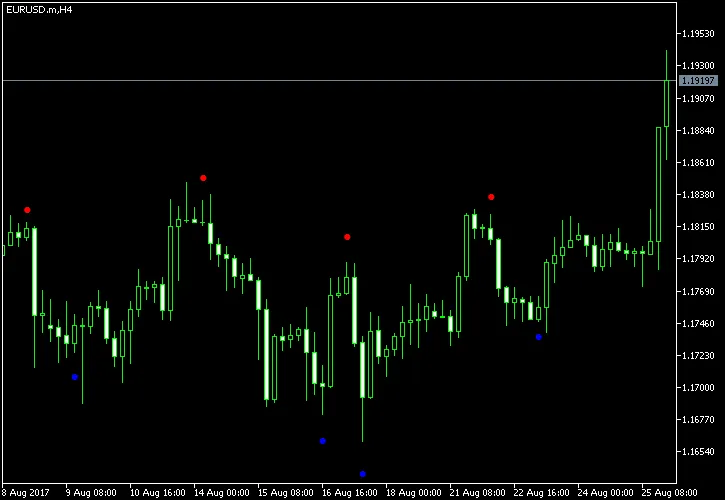
Beginner’s MT4 Indicator – This is a straightforward custom indicator designed for MetaTrader 4 that highlights local tops and bottoms on your chart with red and blue dots. It works by analyzing the maximums and minimums over a specific period and compares them to the trading range of the currency pair. If it identifies a significant top or bottom, it marks it with a dot. Keep in mind, this indicator redraws itself, so it’s not reliable for generating trading signals since the position of the dots can change. Input Parameters AllBars (default = 0) – This parameter determines the number of bars used for calculations. Setting it to 0 means all bars will be considered, and there’s typically no need to adjust this. Otstup (default = 30) – This represents the percentage cut from the range before the maximums and minimums are compared to establish their significance. A higher number here leads to more frequent dot placements. Per (default = 9) – This defines the period over which the maximums and minimums are calculated at any given time. Increasing this number will result in fewer dots being displayed. It’s crucial to understand that this indicator shouldn’t be used for direct trading signals. For instance, you can’t just sell when a red dot appears or buy when a blue dot shows up – doing so could lead to losses. Instead, think of this tool as a quick way to identify support and resistance levels if you’re trading a breakout system or if you’re looking to develop your own indicators.

2025.01.30
Beginner's Guide to the MT5 Indicator: Find Local Tops and Bottoms
MetaTrader5
Beginner's Guide to the MT5 Indicator: Find Local Tops and Bottoms

The Beginner's MetaTrader 5 Indicator is a straightforward custom tool designed for traders who want to identify local highs and lows on their charts with easy-to-spot red and blue dots. This handy indicator analyzes the recent maximums and minimums over a specified period and compares them to the current trading range of the currency pair. If a top or bottom stands out as significant, it gets marked with a dot. However, keep in mind that this indicator redraws itself, which means it’s not suitable for generating actual trading signals, as the dot positions can change. Input Parameters AllBars (default = 0) — This setting determines how many bars are used for calculations. Setting it to 0 means it will consider all bars. There’s really no need to tweak this. Otstup (default = 30) — This parameter represents the percentage of the range that is cut off before comparing maximums and minimums. A higher value here will lead to more frequent dot appearances. Per (default = 9) — This defines the period over which maximums and minimums are calculated. The larger the number, the fewer dots will be displayed. Important Note: It's crucial to remember that this indicator should not be used for actual trading decisions. For instance, simply selling when a red dot appears or buying with a blue dot could lead to losses. Instead, this indicator can serve as a quick way to pinpoint support and resistance levels, especially if you’re working with a breakout trading strategy or looking to build your own indicators.

2025.01.30
Unlocking the BB MACD Indicator for MT5: Your Guide to Trend Detection
MetaTrader5
Unlocking the BB MACD Indicator for MT5: Your Guide to Trend Detection

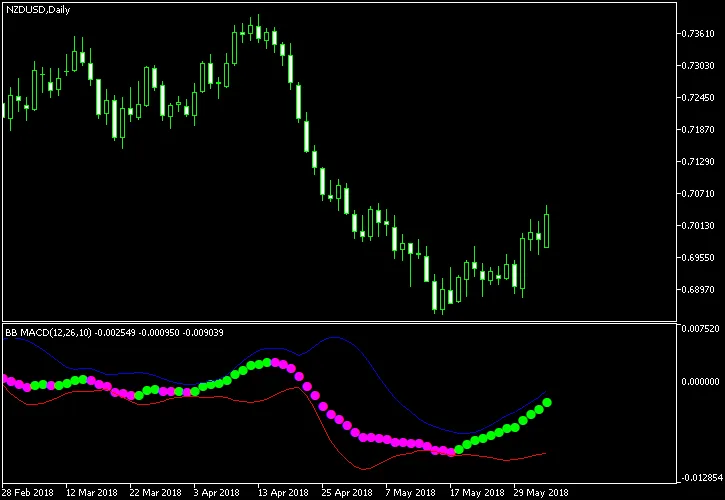
What is the BB MACD Indicator? The BB MACD MetaTrader indicator is a handy variation of the classic MACD (Moving Average Convergence Divergence) that helps traders spot potential trend changes and gauge the strength of ongoing trends. You'll find this indicator displayed in a separate window on your chart, featuring two lines (a blue line and a red line) along with dots that can appear in either green or magenta. A color change in the dots can signal trading opportunities, while the gap between the two lines shows how strong the current trend is. This tool is compatible with both MT4 and MT5. Input Parameters FastLen (default = 12) — This is the period for the fast-moving average, which plays a crucial role in calculating the indicator's dots. SlowLen (default = 26) — This parameter sets the period for the slow-moving average, which is used for the same calculations as the fast moving average. Length (default = 10) — This is the period used for the moving average and standard deviation calculations that affect the indicator's lines. barsCount (default = 400) — This defines the maximum number of bars on the chart that the calculations will consider. StDv (default = 2.5) — This weight multiplier adjusts the impact of the standard deviation in relation to the moving average. EnableNativeAlerts (default = false) — Set this to true to receive MetaTrader's pop-up alerts when the BB MACD color changes. EnableSoundAlerts (default = false) — If you want sound alerts for color changes, set this to true. EnableEmailAlerts (default = false) — Set this to true to receive email alerts on BB MACD color changes. Make sure your email is configured correctly in MetaTrader under Tools -> Options -> Email. EnablePushAlerts (default = false) — If you wish to get push notifications on your device for BB MACD color changes, set this to true. Ensure notifications are set up in MetaTrader via Tools -> Options -> Notifications. SoundFileName (default = "alert.wav") — This is the name of the sound file that will play for alerts if EnableSoundAlerts is true. Looking at the chart example, you'll notice that a buy signal occurs when the magenta dots turn green, while a sell signal appears when the green dots switch back to magenta. It's generally best to trade when the blue and red lines are fairly wide apart, indicating a robust trend.

2025.01.30
Mastering the BB MACD Indicator for MT4: Your Guide to Trend Detection
MetaTrader4
Mastering the BB MACD Indicator for MT4: Your Guide to Trend Detection

Welcome to the BB MACD Indicator for MetaTrader 4! This powerful tool is a variation of the classic MACD (Moving Average Convergence Divergence) indicator, designed to help you spot trend changes and gauge the strength of ongoing trends. You’ll find it displayed in a separate window on your chart, featuring two lines (one blue and one red) and dots that can appear in either green or magenta. Keep an eye on those dot color changes—they're your best friend when it comes to identifying potential trading signals. Plus, the gap between the two lines offers insight into the trend's strength. Good news: this indicator is available for both MT4 and MT5! Input Parameters FastLen (default = 12) — This sets the period for the fast moving average, which is the lower period used in the dot calculations. SlowLen (default = 26) — This is the period for the slow moving average, the higher period involved in the dot calculations. Length (default = 10) — This parameter controls the period for the moving average and standard deviation indicators used in the line calculations. barsCount (default = 400) — This sets the maximum number of bars on the chart that will be considered for calculations. StDv (default = 2.5) — This is the weight multiplier for the standard deviation indicator, balancing its role in calculations against the moving average. EnableNativeAlerts (default = false) — Set to true to activate MetaTrader's native pop-up alerts when the BB MACD color changes. EnableSoundAlerts (default = false) — Set to true to receive sound alerts upon BB MACD color changes. EnableEmailAlerts (default = false) — Set to true to have email alerts sent when the BB MACD color changes. Ensure your email settings are configured in MetaTrader under Tools -> Options -> Email. EnablePushAlerts (default = false) — Set to true to receive push notifications on your device when the BB MACD color changes. Make sure to configure notifications in MetaTrader via Tools -> Options -> Notifications. SoundFileName (default = "alert.wav") — This is the sound file that will play for alerts if EnableSoundAlerts is set to true. As illustrated in the chart example, a buy signal occurs when the magenta dots turn green, while a sell signal is triggered when the green dots switch to magenta. For optimal trading, look for situations where both the blue and red lines are relatively wide apart.

2025.01.30
First Previous 7 8 9 10 11 12 13 14 15 16 17 Next Last