Technical Indicator

Mastering Round Levels in MT5: Your Go-To Indicator for Trading Success
MetaTrader5
Mastering Round Levels in MT5: Your Go-To Indicator for Trading Success

Unlock Your Trading Potential with the Round Levels Indicator for MetaTrader 5 – This handy tool is designed to help you identify key round levels and the zones surrounding them, perfectly tailored to your trading strategy. Understanding these psychological support and resistance levels can give you an edge in your trades. Plus, it can send you alerts when the price hits these crucial zones, ensuring you never miss a trading opportunity! Input Parameters You Need to Know Levels (default = 5) — This sets the number of round levels the indicator will analyze in both upward and downward directions. Interval (default = 50) — This determines the spacing in points between round levels. So, with a default of 50, you'll see a level drawn every 50 points. Zone Width (default = 10) — This controls the width of the zone in points, giving you a clear visual of the area around each round level. Color Up (default = clrFireBrick) — This sets the color for the round level zones above the current price, making it easy to spot potential resistance areas. Color Down (default = clrDarkGreen) — This sets the color for the zones below the current price, marking potential support areas. Invert Zones (default = false) — When enabled, this option highlights areas outside the zone boundaries, giving you a different perspective on market movements. Zones As Background (default = true) — If activated, the round number zones will be displayed behind your chart, allowing for a cleaner view of your price action. Draw Lines (default = false) — Enable this to draw lines at each round level, in addition to the zones, for added clarity. Line Color (default = clrDarkGray) — This sets the color for the lines representing the round levels. Line Width (default = 1) — This controls the thickness of the round level lines for better visibility. Line Style (default = STYLE_DASHDOT) — Choose the style of the round level lines to suit your preferences. Lines as Background (default = false) — If set to true, the round number lines will appear behind your chart plot. Show Line Labels (default = false) — Enabling this option will display labels indicating the price level of each line. Line Label Color (default = clrWhite) — This sets the color for the line labels, ensuring they stand out against your chart. Object Prefix (default = 'RoundLevels') — This prefix is added to the names of the chart objects. Change it only if there's a conflict with other indicators. Enable Notify (default = false) — When true, the indicator will send notifications when the price enters a zone. Send Alert (default = true) — If notifications are enabled, this allows the indicator to generate built-in popup alerts. Send App (default = false) — This option allows for push notifications to be sent to your mobile device if enabled. Send Email (default = false) — Enable this to receive email alerts when the price hits the zones. Alert Delay (default = 5) — This sets the time delay in seconds between consecutive alerts for better management.

2025.02.02
Unlock Trading Potential with the Recent High/Low Alert Indicator for MT4
MetaTrader4
Unlock Trading Potential with the Recent High/Low Alert Indicator for MT4

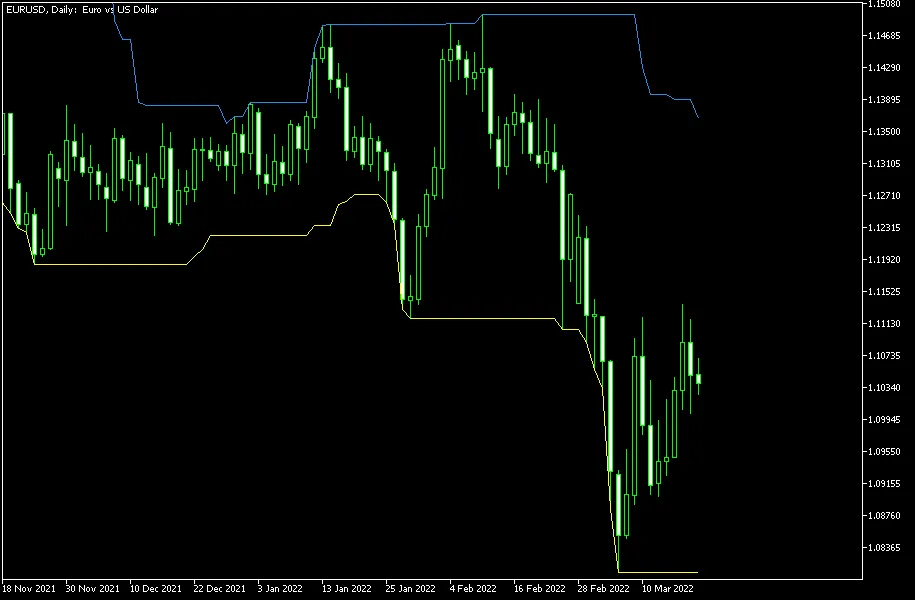
Stay Ahead with the Recent High/Low Alert Indicator for MetaTrader 4 — This handy tool displays two bands representing the maximum and minimum levels across the latest N candles. By default, you’ll see the maximum band marked with a blue line and the minimum band highlighted in yellow. Plus, it can send you a popup alert, an email, or a notification whenever the current Bid price breaks through these recent High or Low levels. Don’t worry, you can turn all alerts off if you prefer a quieter trading experience. If you’re using the email alert feature, make sure to set up your email settings in the options window of your MetaTrader platform. The same goes for push notifications. You can utilize this indicator on both MT4 and MT5 platforms. Input Parameters N (default = 20) — the period value for determining the recent High/Low levels. EnableNativeAlerts (default = false) — if set to true, you’ll receive a native MetaTrader popup alert when the price crosses above or below the High/Low bands. EnableEmailAlerts (default = false) — if set to true, an email will be sent when the price breaches the High/Low bands. Make sure your email is configured correctly in MetaTrader via Tools -> Options -> Email. EnablePushAlerts (default = false) — if set to true, you’ll receive a push notification when the price crosses the bands. Ensure your notifications are set up in MetaTrader through Tools -> Options -> Notifications. TriggerCandle (default = Previous) — the candle that triggers alerts: Previous refers to the most recently closed candle, while Current refers to the still-open candle. This indicator can be a game-changer in your trading strategy. Use the recent high or low levels as a trailing stop-loss when closing positions. These levels can also be great entry points for new trades. While they might not stand alone as strong signals, breaking through recent extremes can serve as confirmation for other signals you’re following. With customizable alert options, you’ll be ready to react promptly to market changes.

2025.02.02
Stay Ahead with the Recent High/Low Alert Indicator for MT5
MetaTrader5
Stay Ahead with the Recent High/Low Alert Indicator for MT5

Get Notified with the Recent High/Low Alert Indicator for MetaTrader 5 — This handy tool shows you two key bands representing the maximum and minimum levels over the last N candles. By default, you'll see the maximum band marked with a blue line and the minimum band with a yellow line. What’s great is that it can send you alerts via pop-up, email, or push notification whenever the current price (Bid) crosses these recent high or low levels. And if you want a quiet trading day, you can easily turn off all alerts. Just remember, if you’re using the email alert feature, make sure to set up your email settings in the MetaTrader options. The same goes for push notifications. Plus, this indicator is available for both MT4 and MT5! Input Parameters N (default = 20) — This is the period value for the recent High/Low levels. EnableNativeAlerts (default = false) — Set this to true to receive a native MetaTrader popup alert when the price breaks above or below the High/Low bands. EnableEmailAlerts (default = false) — When set to true, an email notification will be sent when the price breaches the High/Low bands. Make sure your email is configured in MetaTrader via Tools->Options->Email. EnablePushAlerts (default = false) — If set to true, you’ll receive push notifications when the price crosses the bands. Ensure notifications are configured in MetaTrader via Tools->Options->Notifications. TriggerCandle (default = Previous) — Choose the candle that will trigger alerts: Previous for the most recently closed candle or Current for the ongoing candle. This indicator can be a game changer in various ways. You can use the recent high or low levels as a trailing stop-loss for exiting positions, or as entry points for new trades. While it might not be the strongest primary signal, breaking these recent extremes can confirm other signals you’re watching. The customizable notification options make it easy to stay on top of these critical price movements.

2025.02.02
Mastering the Range Expansion Index (REI) for MT4 Trading
MetaTrader4
Mastering the Range Expansion Index (REI) for MT4 Trading

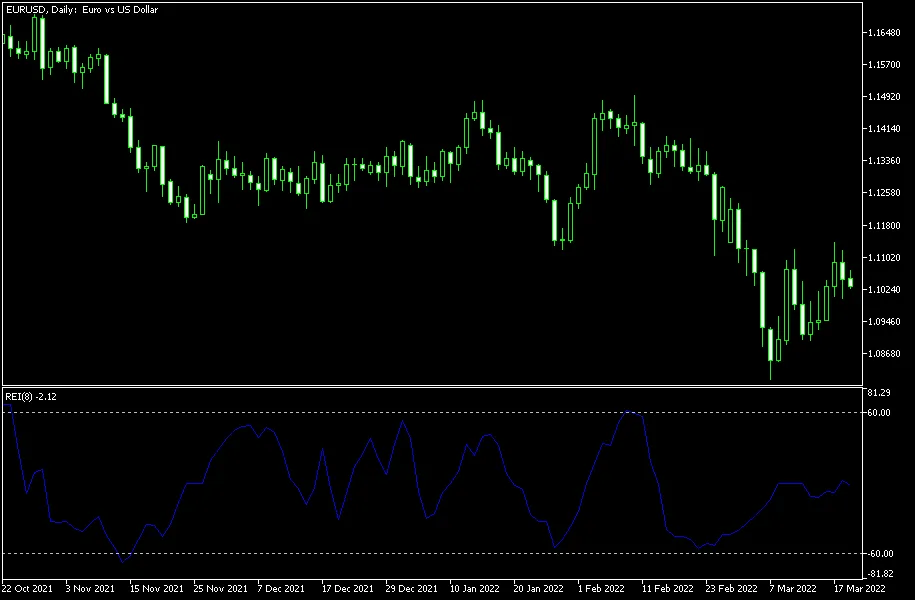
Understanding the Range Expansion Index (REI) in MetaTrader 4 — The Range Expansion Index is a relative oscillator that helps traders gauge the speed of price changes. It provides vital signals for overbought and oversold conditions, especially when the price shows signs of strength or weakness. Developed by Tom DeMark, this indicator is detailed in his book, The New Science of Technical Analysis. The REI operates on a scale from -100 to +100, making it a reliable tool for identifying market conditions. How the REI Works The REI stands out as an advanced oscillator because it tends to maintain stability during range-bound markets, issuing signals primarily when significant peaks or troughs are detected. You can easily download the REI for both MT4 and MT5 platforms. Input Parameters for the REI REI_Period (default = 8) — This indicates the period for the indicator. Increasing the value will yield fewer but more accurate signals, while decreasing it will generate more signals that may be less reliable. It’s best to stick with the default setting. EnableNativeAlerts (default = false) — Set this to true to receive MetaTrader's native pop-up alerts when the REI crosses above level 60 or below level -60. EnableEmailAlerts (default = false) — Toggle this to true if you want to receive email alerts when the REI crosses those key levels. Ensure your email settings are configured in MetaTrader through Tools -> Options -> Email. EnablePushAlerts (default = false) — Set this to true for push notifications to your device when the REI crosses level 60 from above or level -60 from below. Make sure notifications are set up correctly in MetaTrader via Tools -> Options -> Notifications. TriggerCandle (default = Previous) — This defines which candle will trigger alerts: Previous refers to the most recently closed candle, while Current refers to the candle that is still forming. Tom DeMark recommends using the default period of 8 for optimal results. A bearish signal is triggered when the price rises above level 60 and then falls below it. Conversely, a bullish signal occurs when the price dips below level -60 and later rises above it. While I find oscillators like the REI can be a bit hit-or-miss, they can be quite handy on lower timeframes.

2025.02.01
Mastering the Range Expansion Index (REI) on MT5: A Trader's Guide
MetaTrader5
Mastering the Range Expansion Index (REI) on MT5: A Trader's Guide

Understanding the Range Expansion Index (REI) for MT5 — If you're looking to step up your trading game, the Range Expansion Index (REI) is one tool you definitely want to add to your arsenal. This relative oscillator indicator, developed by the renowned Tom DeMark, is designed to measure the speed of price changes, signaling potential overbought or oversold conditions based on market strength or weakness. Tom dives deeper into this concept in his insightful book, The New Science of Technical Analysis. The REI operates on a scale from -100 to +100, and it stands out as an advanced oscillator. What makes it unique is its ability to maintain composure during range trading, only flashing signals when significant peaks or troughs arise. Best of all, you can download this handy indicator for both MT4 and MT5 platforms. Input Parameters REI_Period (default = 8) — This parameter sets the period for the indicator. If you want fewer but more precise signals, consider increasing this value. Conversely, reducing it will yield more signals, but they may be less accurate. It's advisable to stick with the default setting. EnableNativeAlerts (default = false) — Set this to true if you want MetaTrader to use its native pop-up alerts when the indicator crosses the 60 level from above or the -60 level from below. EnableEmailAlerts (default = false) — When set to true, this option triggers email alerts through MetaTrader when the indicator crosses the mentioned levels. Make sure your email settings are configured correctly in MetaTrader via Tools -> Options -> Email. EnablePushAlerts (default = false) — If you prefer push notifications to your device, switch this to true. Just ensure your notifications are set up in MetaTrader via Tools -> Options -> Notifications. TriggerCandle (default = Previous) — This setting allows you to choose which candle will trigger alerts: Previous indicates the most recently closed candle, while Current refers to the ongoing candle. Tom DeMark recommends using the default period of 8. A bearish signal is triggered when the price moves above level 60 and subsequently falls below it. On the flip side, a bullish signal occurs when the price dips below level -60 and then climbs back above. While some traders find this indicator a bit hit-or-miss (like many oscillators), I’ve noticed it can be surprisingly effective on lower timeframes.

2025.02.01
Unlocking the Power of the Rainbow Multiple Moving Average (RMMA) for MT4 Trading
MetaTrader4
Unlocking the Power of the Rainbow Multiple Moving Average (RMMA) for MT4 Trading

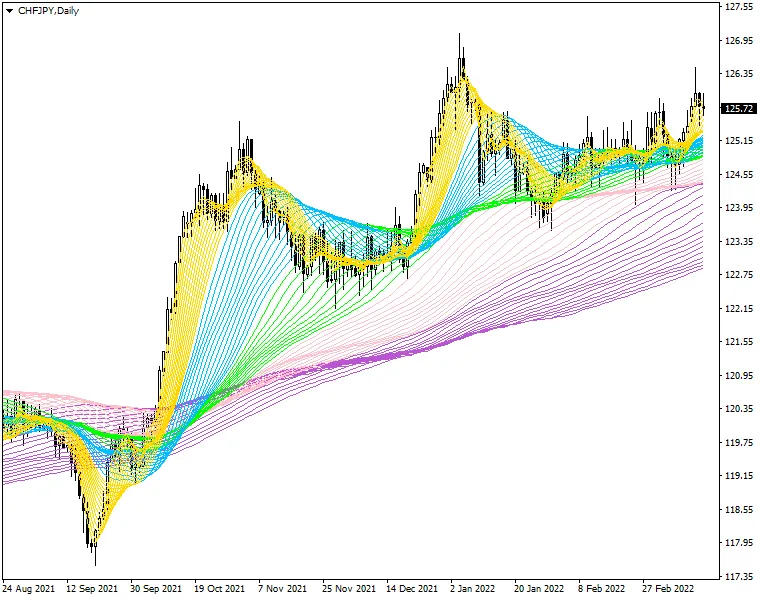
If you’re looking to add a splash of color to your trading strategy, the Rainbow Multiple Moving Average (RMMA) indicator for MetaTrader 4 (MT4) is just what you need! This user-friendly tool not only enhances your charts visually but also provides insightful data to help you make informed trading decisions. What is RMMA? The RMMA indicator is based on standard moving averages, but with a twist—it features 66 rainbow-colored moving average lines that you can customize according to your trading preferences. This helps to visualize trends and potential entry and exit points directly within the main chart window, making it a valuable addition to any trader’s toolkit. Key Input Parameters MA_Type (default = MODE_EMA): The type of moving average you want to use for the rainbow effect. MA_Price (default = PRICE_CLOSE): Select the price type that will be used in the moving average calculations. MA_Period_NN (default = Varies): This determines the periods for the 66 moving averages, allowing you to tailor the indicator to your strategy. Example and Trading Strategy Here's a visual representation of how the RMMA can enhance your trading: Utilizing the RMMA effectively involves observing the interactions between the rainbow lines and price movements. Traders often look for convergence and divergence between the moving averages and the price to identify potential trading opportunities. Incorporating the RMMA into your trading strategy can offer clearer insights into market trends. So why not give it a try and see how it colors your trading journey?

2025.02.01
Mastering the QQE Indicator for MT4: A Trader's Guide
MetaTrader4
Mastering the QQE Indicator for MT4: A Trader's Guide

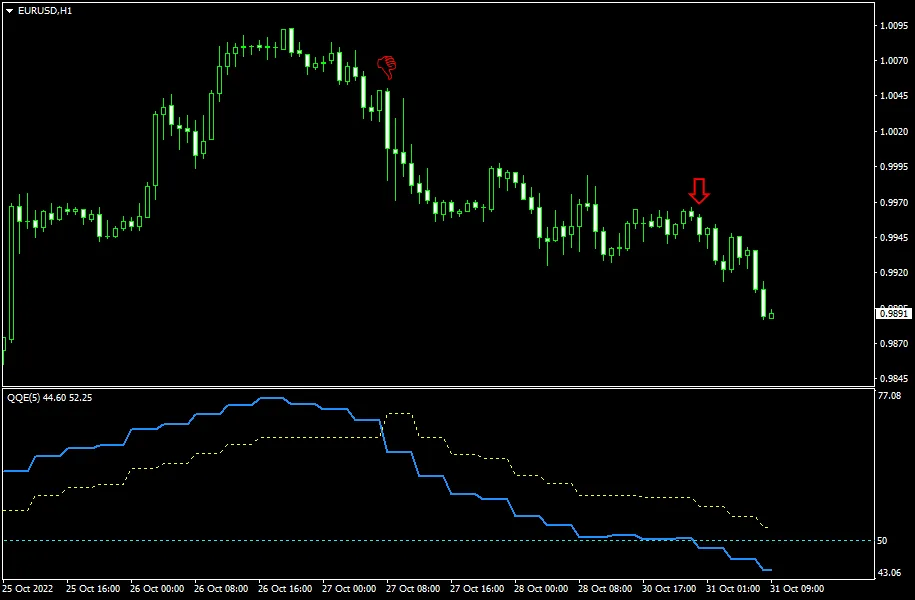
The QQE Indicator for MetaTrader 4, standing for Quantitative Qualitative Estimation, is a powerful tool that utilizes a sophisticated calculation of smoothed RSI indicators. This results in two distinct lines displayed in a separate indicator window: a fast line and a slow line. A key level to watch for is 50, which plays a crucial role in generating trading signals. You can also set up text, sound, and email alerts to keep you informed. Plus, this QQE version supports multi-timeframe analysis, allowing you to view upper timeframe data right on your charts. It's compatible with both MT4 and MT5. The version of the QQE indicator we’re discussing is free and open-source, making it a breeze to download and install on your trading platform. Input Parameters SF (default = 5) — Smoothing factor. AlertOnCrossover (default = false) — Set to true to enable alerts when the two QQE lines cross each other. AlertOnLevel (default = false) — Set to true to receive alerts when the QQE RSI line crosses the specified level. AlertLevel (default = 50) — The alert level for the indicator. It's best not to change this. ArrowsOnCrossover (default = true) — Set to true to draw arrows on the chart when the QQE lines cross. CrossoverUpArrow (default = clrGreen) — Color of the arrow for a bullish crossover. CrossoverDnArrow (default = clrRed) — Color of the arrow for a bearish crossover. ArrowsOnLevel (default = true) — Set to true to draw arrows when the QQE RSI line crosses the specified level. LevelUpArrow (default = clrGreen) — Arrow color for an upward level cross. LevelDnArrow (default = clrRed) — Arrow color for a downward level cross. NativeAlerts (default = false) — Set to true to receive message alerts. EmailAlerts (default = false) — Set to true to receive email alerts based on your MetaTrader email settings. NotificationAlerts (default = false) — Set to true to receive push notifications based on your MetaTrader notification settings. UpperTimeframe (default = PERIOD_CURRENT) — If set to a higher timeframe, the indicator will calculate data based on that timeframe. ObjectPrefix (default = "QQE-") — The prefix for chart objects to ensure compatibility with other indicators. Strategy and Example The QQE indicator serves as an oscillator that can be utilized for both direct signaling and divergence analysis. It generates two types of signals: when the two lines cross each other, and when the blue line crosses a certain level. A sell signal occurs when the blue line crosses the yellow line from above, while a buy signal is triggered when it crosses from below. Similarly, if the blue line crosses a specified level from above, it indicates a sell signal, and crossing from below suggests a buy signal. In the example below, we have a EUR/USD hourly chart featuring a QQE instance that uses 4-hour chart data for plotting the lines. The two red arrows highlight bearish signals: the first arrow indicates a crossover of the lines, while the second arrow corresponds to the blue line crossing the 50 level.

2025.02.01
Mastering the QQE Indicator on MT5: A Trader's Guide
MetaTrader5
Mastering the QQE Indicator on MT5: A Trader's Guide

What is the QQE Indicator? The QQE, or Quantitative Qualitative Estimation, is a powerful tool for traders using MetaTrader 5 (MT5). This indicator is built on a sophisticated calculation of smoothed RSI values, resulting in two distinct lines within a dedicated indicator window—one fast and one slow. An important level to keep an eye on is the 50-mark, which serves as a key reference point for trading signals. Plus, you can set up text, sound, and email alerts to keep you in the loop. This QQE version also supports multi-timeframe analysis, allowing you to view higher timeframe data while trading. It’s compatible with both MT4 and MT5 platforms. What’s great is that the QQE indicator is free and open-source, making it easy for you to download and install on your trading platform. Input Parameters SF (default = 5) — Smoothing factor for the indicator. AlertOnCrossover (default = false) — Set to true to receive alerts when the two QQE lines cross. AlertOnLevel (default = false) — Set to true to get alerts when the QQE RSI line crosses a specified level. AlertLevel (default = 50) — This is the level for alerts; it's advised not to change it. ArrowsOnCrossover (default = true) — Set to true to visualize arrows on the chart when QQE lines cross. CrossoverUpArrow (default = clrGreen) — Color for bullish crossover arrows. CrossoverDnArrow (default = clrRed) — Color for bearish crossover arrows. ArrowsOnLevel (default = true) — Set to true to see arrows on the chart when the QQE RSI line crosses the defined level. LevelUpArrow (default = clrGreen) — Color for arrows when the line crosses up. LevelDnArrow (default = clrRed) — Color for arrows when the line crosses down. NativeAlerts (default = false) — Set to true for in-platform message alerts. EmailAlerts (default = false) — Set to true to receive email alerts based on your MetaTrader settings. NotificationAlerts (default = false) — Set to true for push notifications to your device. UpperTimeframe (default = PERIOD_CURRENT) — If set to a higher timeframe, the indicator will calculate using that timeframe's data. ObjectPrefix (default = "QQE-") — This is for naming chart objects to avoid conflicts with other indicators. Strategy and Example The QQE indicator acts as a versatile oscillator, suitable for direct signals or divergence analysis. It provides two types of signals: when the two lines cross and when the blue line crosses a specific level. A sell signal is generated when the blue line crosses the yellow line from above, and a buy signal when it crosses from below. Similarly, if the blue line crosses the designated level from above, it indicates a sell, while crossing from below suggests a buy. Take a look at the example below, which features an hourly chart of EUR/USD. This QQE instance utilizes data from the 4-hour chart to plot its lines. The two red arrows indicate bearish signals; the first arrow represents a crossover of the lines, while the second is triggered by the blue line crossing the 50 level.

2025.02.01
Master Your Trading with Price Alert MT4 Indicator
MetaTrader4
Master Your Trading with Price Alert MT4 Indicator

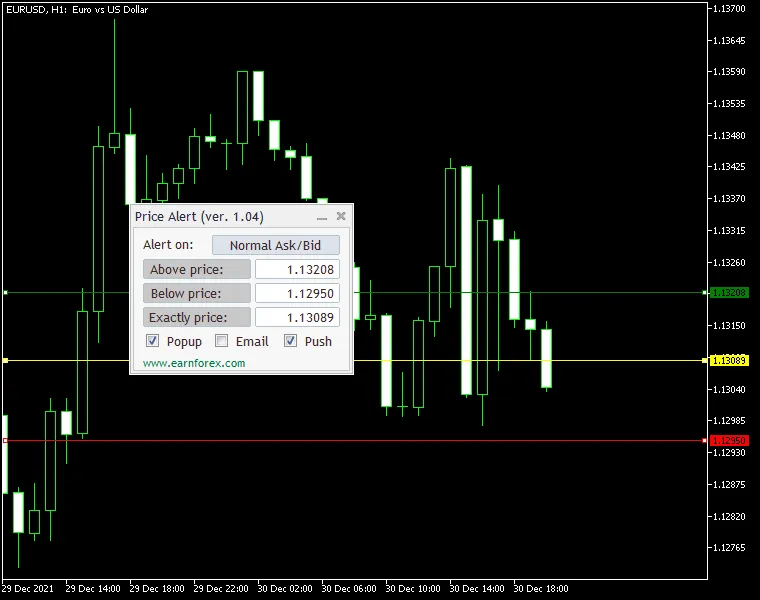
Price Alert MT4 Indicator is your go-to tool for staying on top of price movements. It allows you to set alerts based on specific price levels tailored to your trading strategy. You'll have three price levels to work with: Above Level - Triggered when the price rises above a certain point, marked with a green line on your chart. Below Level - Activated when the price drops below a set level, indicated by a red line. Exact Level - Notified when the price hits a specific value, highlighted with a yellow line. The alert options include native alerts (popup), email notifications, and push notifications. To get email and push notifications, make sure to configure your email or MetaQuotes ID in the MetaTrader platform settings. This handy indicator works on both MT4 and MT5 platforms and comes with an intuitive control panel, making it easy to set your desired alert levels and types. Input Parameters Main Settings PriceGoesAbove (default = 0.0) - Set this to trigger an alert when the price exceeds this value. PriceGoesBelow (default = 0.0) - Set this to trigger an alert when the price falls below this value. PriceIsExactly (default = 0.0) - Set this to trigger an alert when the price is exactly at this value. NativeAlert (default = false) - If set to true, you'll get a native platform alert (popup with sound). SendEmail (default = false) - If set to true and your email settings are correctly configured, you'll receive an email alert. SendPush (default = false) - If set to true and your MetaQuotes ID is configured, you'll get a push notification on your mobile device. AlertOnPrice (default = Normal Ask/Bid) - Choose the type of price for alerts: normal Ask/Bid, only Ask, only Bid, or Close of the previous candle. PanelOnTopOfChart (default = true) - If set to true, the alert panel will display in the foreground; setting it to false will reveal the chart behind the panel. Line Settings Above Line Color (default = clrGreen) - Choose the color for the above level line. Below Line Color (default = clrRed) - Choose the color for the below level line. Exactly Line Color (default = clrYellow) - Choose the color for the exact level line. Above Line Style (default = STYLE_SOLID) - Set the style for the above line. Below Line Style (default = STYLE_SOLID) - Set the style for the below line. Exactly Line Style (default = STYLE_SOLID) - Set the style for the exact line. Above Line Width (default = 1) - Determine the width of the above line. Below Line Width (default = 1) - Determine the width of the below line. Exactly Line Width (default = 1) - Determine the width of the exact line. Position Settings PanelPositionX (default = 0) - Sets the default horizontal distance from the corner you selected for the panel. PanelPositionY (default = 15) - Sets the default vertical distance from the corner you selected for the panel. PanelPositionCorner (default = CORNER_LEFT_UPPER) - Determines the default corner where the panel will be placed.

2025.02.01
Mastering the Point-and-Figure Indicator on MetaTrader 5
MetaTrader5
Mastering the Point-and-Figure Indicator on MetaTrader 5

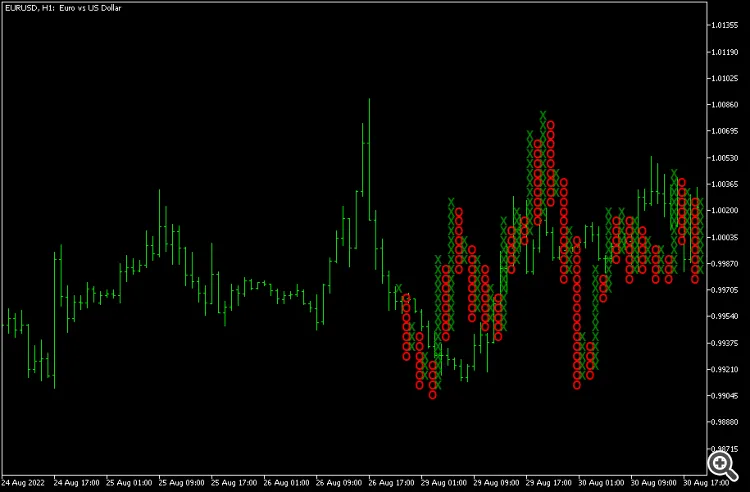
Unleash the Power of the Point-and-Figure Indicator on MetaTrader 5! This nifty tool allows you to plot a point-and-figure chart right in the main window of your usual MT5 chart setup. You can customize all the parameters of the point-and-figure method—like box size and reversal distance—just the way you like it. Plus, you have full control over the display settings for your PnF chart. And don't worry, this indicator supports all kinds of alerts and is based on real tick data, making it exclusive to MT5. So, what’s the deal with point-and-figure charting? Well, it’s an alternative way to visualize price changes that skips the clock and focuses solely on significant shifts in exchange rates. The term “significant” is totally up to you, depending on your trading goals and strategies. Input Parameters BoxSize (default = 60) — This is the box size in points. For a new X or O to appear on the chart, the price must exceed this value. Reversal (default = 3) — This refers to the number of boxes needed for a reversal. The price must reverse by this number of box sizes before the chart switches from X's to O's or the other way around. Days (default = 1) — This sets the number of days for gathering real tick data to create the initial point-and-figure chart. More days mean more data but also require more computing power. PriceToUse (default = Bid) — This determines which price to use for building the point-and-figure chart: Bid — The chart is based on the Bid price. Ask — The chart uses the Ask price. Midprice — This is the average between the Bid and Ask prices. Bid/Ask — X's are based on the Bid price, while O's come from the Ask price. AlertOnXO (default = false) — If set to true, alerts will be triggered whenever a new X or O is printed. AlertOnReversal (default = false) — If true, alerts will be sent when the point-and-figure chart reverses from a column of X's to O's or vice versa. EnableNativeAlerts (default = false) — If true, a native MetaTrader popup alert will be triggered for the above conditions. EnableEmailAlerts (default = false) — If true, an email will be sent for alerts. Make sure your email settings are configured in MetaTrader under Tools->Options->Email. EnablePushAlerts (default = false) — If true, notifications will be sent for alerts. Ensure your notification settings are done in MetaTrader under Tools->Options->Notifications. ColorUp (default = clrGreen) — This color is for the rising point-and-figure symbols (X's). ColorDown (default = clrRed) — This color represents the declining point-and-figure symbols (O's). FontSize (default = 15) — This sets the font size for the chart symbols (X's and O's). Font (default = "Arial") — This is the font used for the chart symbols. X (default = "x") — The symbol used to indicate rising price levels. O (default = "o") — The symbol used to indicate declining price levels. SilentMode (default = true) — If false, details about each printed X and O will appear in the Experts tab of the Toolbox subwindow. MaxObjects (default = 10000) — This sets the maximum number of chart objects (X's and O's) the indicator can create. Use this to prevent overloading your platform with incorrect settings. ObjectPrefix (default = "PNF-") — This is a prefix for chart objects for compatibility with other indicators. Example Check out the image below, which illustrates 4 days of EUR/USD price action condensed into 47 columns of X's and O's with the Point-and-Figure indicator in MT5. The box size is set to 60 points (or 6 pips) with a reversal of 3. Point-and-figure charts still allow for classic support and resistance and trendline analysis. Some traders even dive into PnF chart patterns, like pennants, triangles, and double tops and bottoms. Here’s a quick video showing the Point-and-Figure MT5 indicator plotting a chart for the BTC/USD pair using a $10 (1000 points) box size and a reversal value set to 3:

2025.02.01
Mastering Price Alerts on MT5: Your Ultimate Guide
MetaTrader5
Mastering Price Alerts on MT5: Your Ultimate Guide

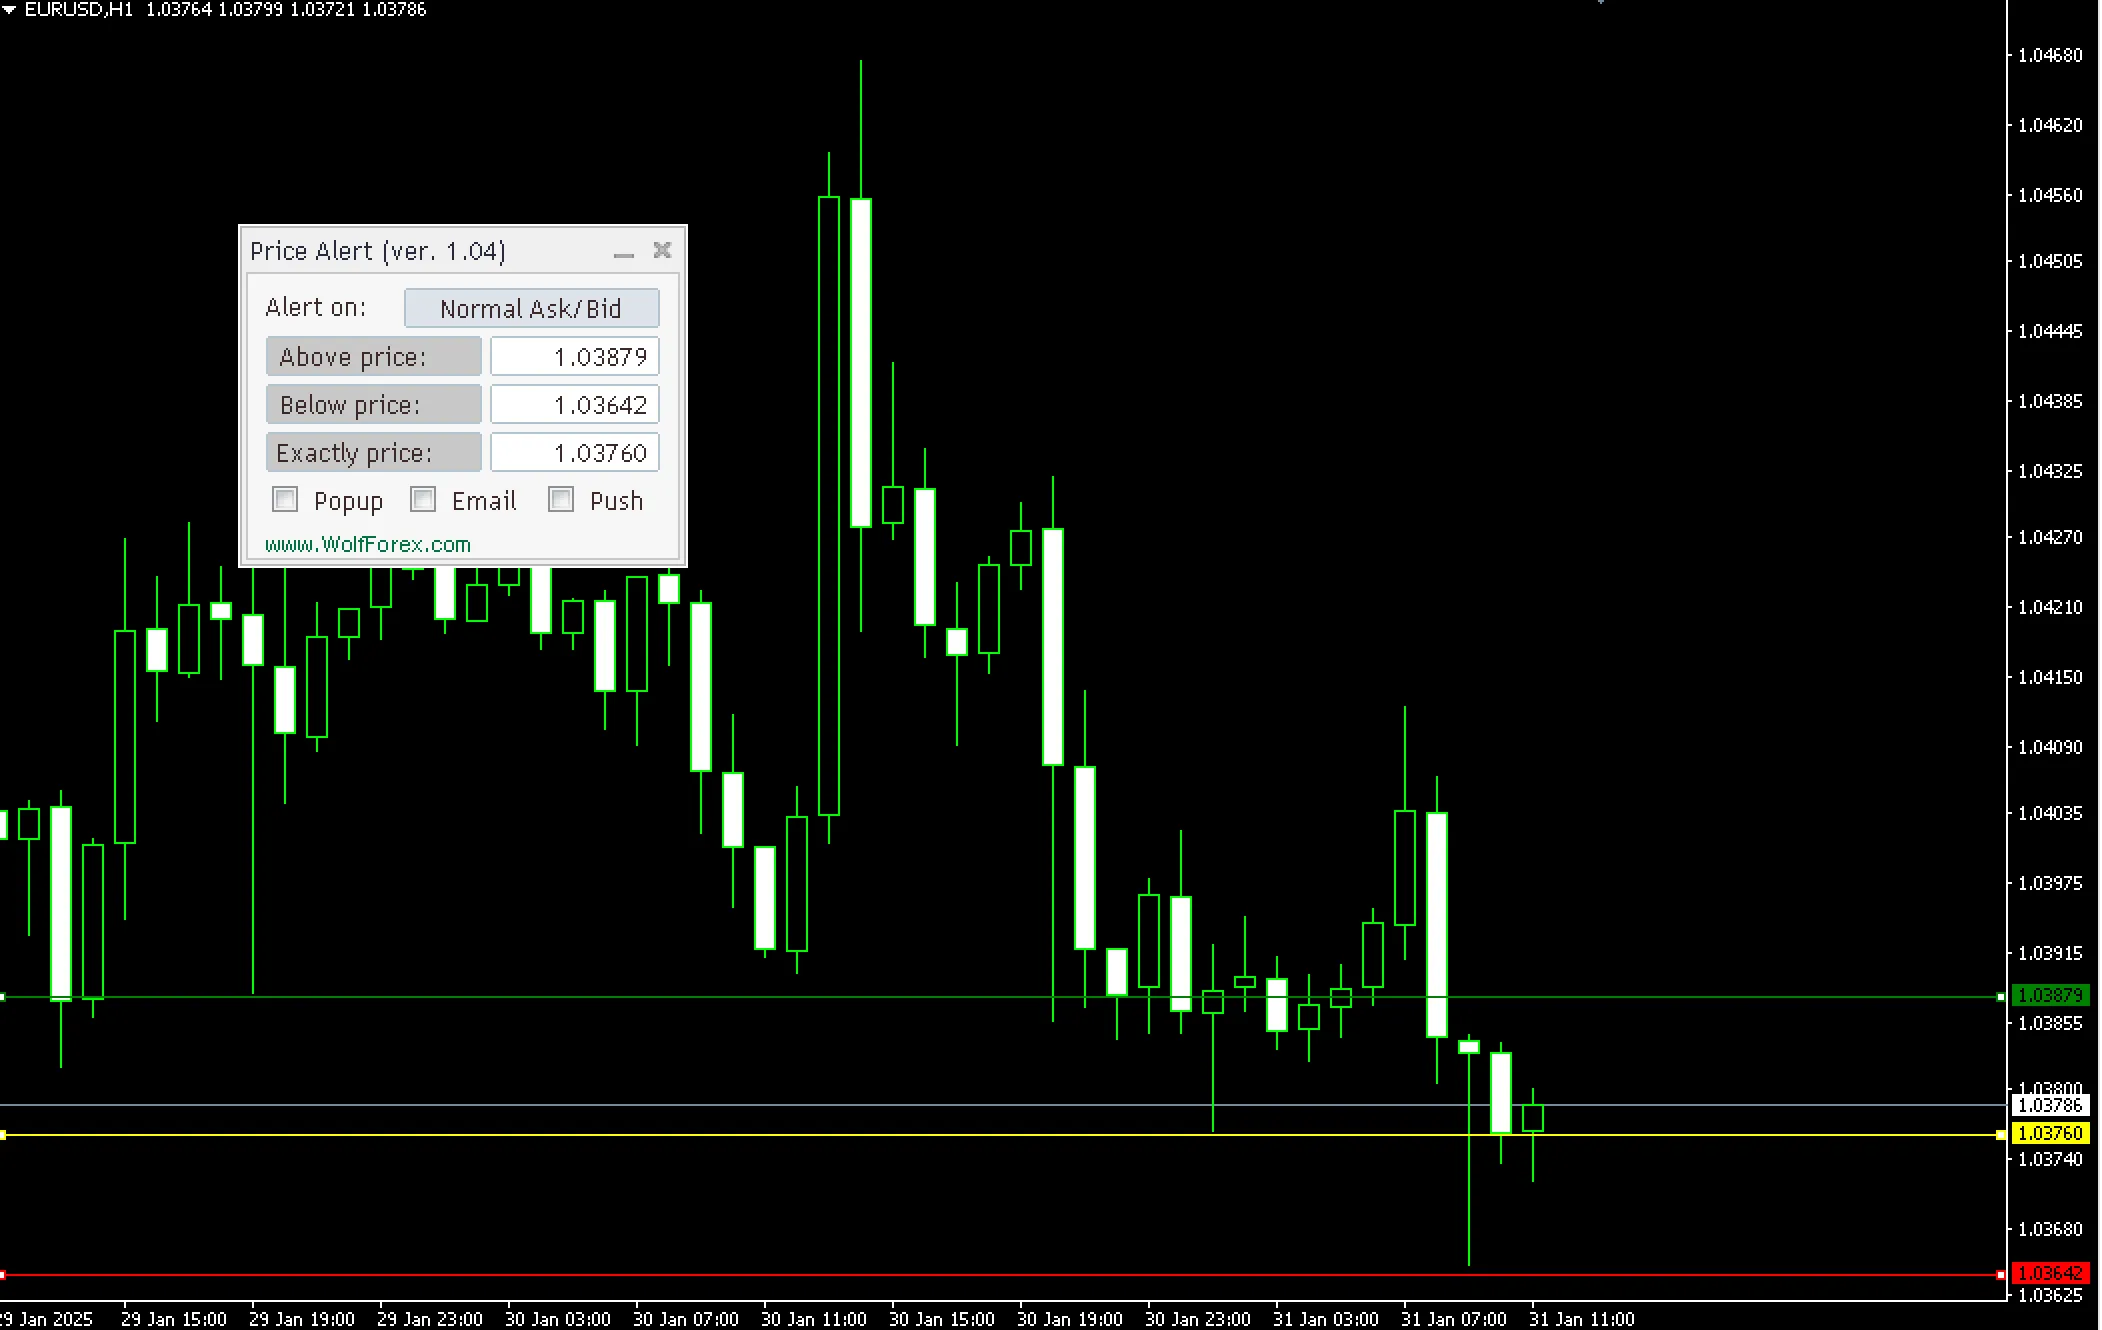
Price Alert Indicator for MetaTrader 5 is a powerful tool that lets you set up alerts when prices hit specific levels. Whether you're looking to catch a breakout or avoid a downturn, this indicator has your back. It offers three price level alerts: The first alert triggers when the price climbs above a pre-set level, shown on your chart with a green line.The second alert activates when the price dips below a certain level, marked by a red line.The third alert goes off when the price hits a specific value exactly, indicated by a yellow line.You'll get three types of notifications: a native popup, email alerts, and push notifications. To make sure the email and push notifications work, you'll need to set up your email or MetaQuotes ID in the MetaTrader options window. And the best part? This indicator is compatible with both MT4 and MT5!The indicator features a handy control panel, allowing you to quickly set your desired alert levels and types.Input Parameters Main Settings PriceGoesAbove (default = 0.0) — Triggers an alert if the price rises above this value. PriceGoesBelow (default = 0.0) — Triggers an alert if the price falls below this value. PriceIsExactly (default = 0.0) — Triggers an alert when the price is exactly this value. NativeAlert (default = false) — If set to true, you'll receive a native platform alert (a popup window with sound). SendEmail (default = false) — If true and your email settings are correct in the MetaTrader options, this will send an email alert. SendPush (default = false) — If true and your MetaQuotes ID is set up correctly, this will send a push notification to your mobile device. AlertOnPrice (default = Normal Ask/Bid) — Select the price type for alerts: normal Ask/Bid, only Ask, only Bid, or the Close of the previous candle. PanelOnTopOfChart (default = true) — If true, the panel will be displayed on top of the chart. Setting it to false will reveal the chart behind the panel. Line Customization Above Line Color (default = clrGreen) — The color of the line for prices above the alert level. Below Line Color (default = clrRed) — The color of the line for prices below the alert level. Exactly Line Color (default = clrYellow) — The color of the line for the exact price level. Above Line Style (default = STYLE_SOLID) — The style of the line for prices above the alert level. Below Line Style (default = STYLE_SOLID) — The style of the line for prices below the alert level. Exactly Line Style (default = STYLE_SOLID) — The style of the line for the exact price level. Above Line Width (default = 1) — The width of the line for prices above the alert level. Below Line Width (default = 1) — The width of the line for prices below the alert level. Exactly Line Width (default = 1) — The width of the line for the exact price level. Panel Positioning PanelPositionX (default = 0) — The horizontal distance from the selected corner for the panel's position. PanelPositionY (default = 15) — The vertical distance from the selected corner for the panel's position. PanelPositionCorner (default = CORNER_LEFT_UPPER) — The default corner where the panel will be positioned.

2025.02.01
Mastering Pinbars: The Essential Pinbar Detector for MT5 Traders
MetaTrader5
Mastering Pinbars: The Essential Pinbar Detector for MT5 Traders

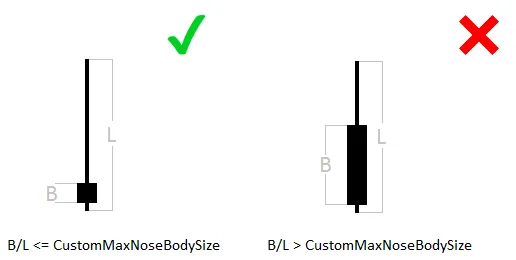
Pinbar Detector is a powerful tool for traders using MetaTrader 5. This indicator is designed to spot Pinbars—those telltale reversal patterns that can signal great trading opportunities. When it detects a Pinbar, it marks it visually with a "smiling face" icon to help you easily identify bullish Pinbars below and bearish Pinbars above. What's great about this tool is that it focuses purely on price action without relying on standard technical indicators. Customize Your Pinbar Detection CountBars (default = 0) — Set the maximum number of bars to scan for Pinbars. A setting of 0 means it will analyze all available bars. DisplayDistance (default = 5) — Adjust how far away the "smiling face" symbols are from the actual Pinbars. UseAlerts (default = true) — Enable sound alerts on your platform when a Pinbar is detected, so you never miss a signal. UseEmailAlerts (default = false) — Get email notifications for Pinbar detections. Make sure to configure your email settings under Tools > Options > Email in MetaTrader. UseNotificationAlerts (default = false) — Set up push notifications for your mobile device by adjusting your settings in Tools > Options > Notifications. UseCustomSettings (default = false) — If you prefer, you can tweak the Pinbar detection parameters with custom settings. CustomMaxNoseBodySize (default = 0.33) — This parameter controls the maximum allowed body-to-length ratio for the Nose bar. CustomNoseBodyPosition (default = 0.4) — Determines where the Nose body should be positioned relative to the Nose bar (top for bullish, bottom for bearish). CustomLeftEyeOppositeDirection (default = true) — This setting ensures that the Left Eye bar is bearish for bullish Pinbars and vice versa. CustomNoseSameDirection (default = true) — Ensures the Nose bar aligns with the direction of the Pinbar pattern. CustomNoseBodyInsideLeftEyeBody (default = false) — Specifies that the Nose body should be contained within the Left Eye body. CustomLeftEyeMinBodySize (default = 0.1) — Sets the minimum body size of the Left Eye relative to the overall bar length. CustomNoseProtruding (default = 0.5) — Defines the minimum protrusion of the Nose bar compared to the overall bar length. CustomNoseBodyToLeftEyeBody (default = 1) — Sets the maximum size of the Nose body in relation to the Left Eye body. CustomNoseLengthToLeftEyeLength (default = 0) — Sets the minimum Nose length compared to the Left Eye length. CustomLeftEyeDepth (default = 0.2) — Determines the minimum depth of the Left Eye relative to its length, defined as the portion of the bar that lies behind the Nose. CustomMinimumNoseLength (default = 1) — Sets the minimum length of the Nose candlestick in points.

2025.01.31
Unlocking the Power of the Pinbar Detector for MT4 and MT5 Traders
MetaTrader5
Unlocking the Power of the Pinbar Detector for MT4 and MT5 Traders

Pinbar Detector is an essential tool for traders using MetaTrader, specifically designed to identify Pinbars—those telltale price action signals that can indicate potential market reversals. This handy indicator highlights bullish Pinbars with a cheerful smiley face below them and bearish Pinbars with a smiley above. What’s great about it is that it relies purely on price action, avoiding the clutter of standard technical indicators, making it straightforward and effective. Why Use the Pinbar Detector? As traders, we know how crucial it is to spot key price action signals. The Pinbar Detector not only identifies these patterns but also allows for custom configuration through its input parameters. Plus, it comes with alert features that keep you in the loop, whether you’re actively trading or away from the charts. Input Parameters Explained CountBars (default = 0) — Set the maximum number of bars to check for Pinbars. Use 0 to scan all bars. DisplayDistance (default = 5) — Adjusts the distance between the candles and the Pinbar smiley symbols. UseAlerts (default = true) — Enables sound alerts on Pinbar detection to keep you informed. UseEmailAlerts (default = false) — Sends an email notification when a Pinbar is detected. Make sure to configure your email settings in MetaTrader under Tools -> Options -> Email. UseNotificationAlerts (default = false) — Activates push notifications on your mobile device. Set this up in Tools -> Options -> Notifications. UseCustomSettings (default = false) — Allows you to apply specific Pinbar detection parameters outlined below. CustomMaxNoseBodySize (default = 0.33) — Sets the maximum body-to-length ratio for the Nose bar. CustomNoseBodyPosition (default = 0.4) — Determines where the Nose body should be positioned within the Nose bar. CustomLeftEyeOppositeDirection (default = true) — Specifies that the Left Eye bar should be bearish for bullish Pinbars and bullish for bearish Pinbars. CustomNoseSameDirection (default = true) — Ensures that the Nose bar moves in the same direction as the overall Pinbar pattern. CustomNoseBodyInsideLeftEyeBody (default = false) — Checks if the Nose body is within the Left Eye body. CustomLeftEyeMinBodySize (default = 0.1) — Sets the minimum size of the Left Eye body compared to the bar length. CustomNoseProtruding (default = 0.5) — Defines the minimum protrusion of the Nose bar relative to the overall bar length. CustomNoseBodyToLeftEyeBody (default = 1) — Sets the maximum size of the Nose body relative to the Left Eye body. CustomNoseLengthToLeftEyeLength (default = 0) — Establishes the minimum Nose length compared to the Left Eye length. CustomLeftEyeDepth (default = 0.2) — Defines the minimum depth of the Left Eye relative to its length. CustomMinimumNoseLength (default = 1) — Sets the minimum length of the Nose candlestick in points.

2025.01.31
Understanding Keltner Channels in MT4: Your Go-To Trading Indicator
MetaTrader4
Understanding Keltner Channels in MT4: Your Go-To Trading Indicator

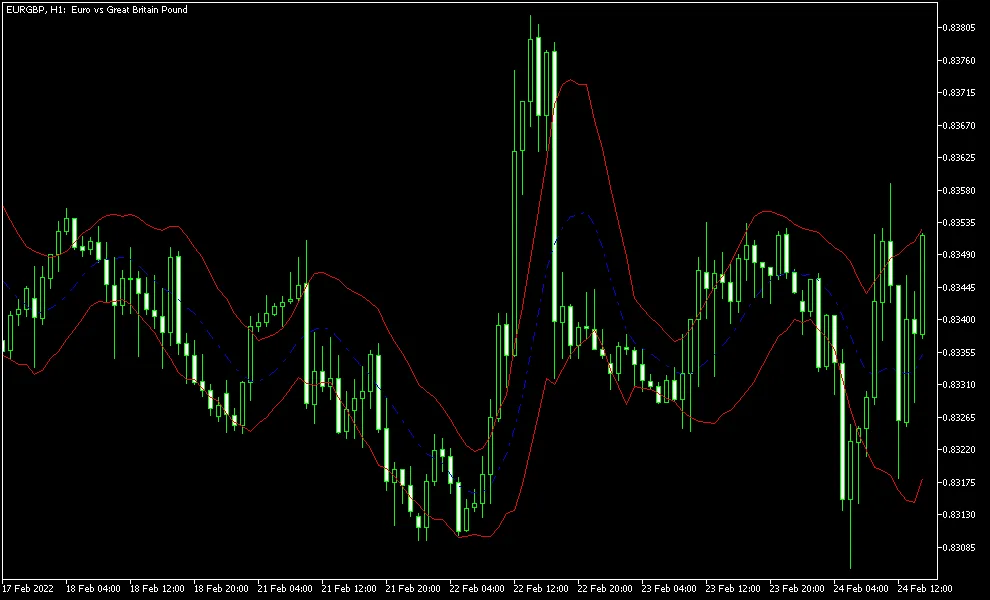
The Keltner Channel is a classic technical analysis tool designed for traders looking to navigate the markets effectively. Developed by Chester W. Keltner back in 1960, this indicator is quite similar to Bollinger Bands and Envelopes, but with its own unique twist. It features three key lines: the middle line is a 10-day simple moving average (SMA) calculated using the typical price, which is the average of the high, low, and close prices. The upper and lower bands are derived by adding and subtracting the average daily price range from this middle line, thus creating a volatility-based channel. Key Input Parameters MA_Period (default = 10) — This sets the period for the moving average that forms the middle line. Mode_MA (default = MODE_SMA) — This parameter determines the type of moving average used for the middle line. Price_Type (default = PRICE_TYPICAL) — This defines which price is used for the moving average calculation. The classic trading strategy with the Keltner Channel is straightforward: go long when the price closes above the upper band and short when it closes below the lower band. This approach offers a solid entry system. For exits, you might consider a conservative stop-loss (as false signals can pop up), a good distance for take-profit, or a cross with the middle line. Some traders also recommend using additional indicators for confirmation before making a move. Mathematically speaking, the Keltner Channel's bands adjust based on market trends; they weigh more heavily towards the upper band during uptrends and towards the lower band during downtrends. This means that in a bullish trend, the upper line is less likely to be breached, while the opposite holds true for bearish trends.

2025.01.31
Mastering the Keltner Channel on MT5: A Trader's Guide
MetaTrader5
Mastering the Keltner Channel on MT5: A Trader's Guide

The Keltner Channel is a classic technical analysis tool that's been around since 1960, thanks to Chester W. Keltner. If you've dabbled in trading, you might find this indicator reminiscent of Bollinger Bands or Envelopes. It features three key lines: the middle line, which is a 10-day simple moving average based on the typical price, calculated as (high + low + close) / 3. Then, we have the upper and lower bands, which are created by adding and subtracting the moving average of the daily price range (the difference between the high and low) from that middle line. In essence, this forms a volatility-based channel. You can tweak all the parameters of the moving average in this version, available for both MT4 and MT5 platforms. Input Parameters MA_Period (default = 10) — This sets the period for the moving average that forms the middle line. Mode_MA (default = MODE_SMA) — This defines the type of moving average used for the middle line. Price_Type (default = PRICE_TYPICAL) — This indicates which price is applied to the moving average (middle line). When it comes to trading with the Keltner Channel, the classic strategy is quite straightforward. You would look to go long when the price closes above the upper band and consider going short when it closes below the lower band. This method can serve as a solid entry system. For exits, you can rely on three main components: setting a conservative stop-loss (since false signals can pop up now and then), opting for a more distant take-profit target, or when the price crosses back through the middle line. Some traders even recommend using additional indicators for added confirmation. Mathematically speaking, the channel is designed to weigh the bands more heavily towards the upper side during uptrends and towards the lower side during downtrends. Essentially, this means that during a strong upward trend, the upper line is less likely to be broken, while in a downtrend, the opposite is true.

2025.01.31
Understanding Gain/Loss Info Indicator for MT4: A Trader's Guide
MetaTrader4
Understanding Gain/Loss Info Indicator for MT4: A Trader's Guide

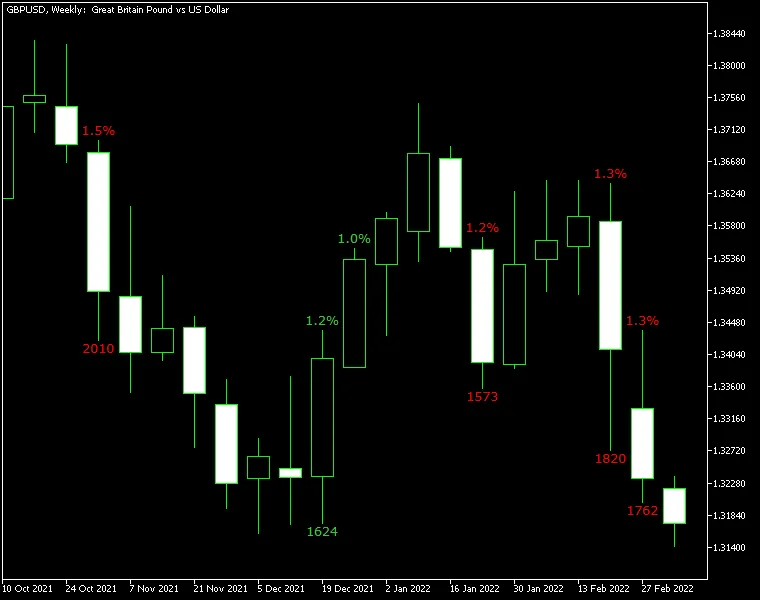
Gain/Loss Info Indicator for MetaTrader 4 — This handy tool lets you track gains and losses for all candles that exceed a certain threshold. It calculates values in both points and percentage, giving you a clear picture of your trades. How It Works The indicator can operate in two modes: it can compare the Close and Open prices of candlesticks or measure the difference between the current Close and the previous Close. You have the flexibility to set minimum change limits in pips and percentage, choose different modes, and customize the font color for the output numbers. Plus, it’s compatible with both MT4 and MT5 platforms! Input Parameters PercentageLimit (default = 1.0) — This sets the minimum threshold for changes to be displayed, measured in percentage points. PointsLimit (default = 1000) — This defines the minimum threshold for changes to be shown, measured in points. CloseToClose (default = true) — If set to true, the indicator compares the current Close to the previous Close; if false, it compares the current Close to the current Open. DisplayLossColor (default = clrRed) — This sets the color for displaying negative price changes. DisplayGainColor (default = clrGreen) — This sets the color for displaying positive price changes. MaxBars (default = 100) — This limits the maximum number of bars the indicator will calculate on. Keep in mind, the higher this number, the more lag the indicator may experience. FontFace (default = "Verdana") — This determines the font for the display. FontSize (default = 10) — This sets the font size for the display. ObjectPrefix (default = "GLI-") — This prefix is used for chart objects to ensure compatibility with other indicators. The chart above illustrates the Gain/Loss Info indicator applied to GBP/USD on a weekly basis. With a percentage limit set at 1.0% and a pips limit of 1,500, the calculation mode was adjusted to "Close vs. previous Close." The points count for the period can be seen below the candles, while the percentage changes are displayed above them. Now, let’s be clear: while this indicator isn’t designed for generating trading signals, it does a great job of simplifying market analysis. It helps you spot bullish and bearish patterns more easily. You can certainly use it to identify significant changes that might signal potential entry or exit points.

2025.01.31
Mastering Gain/Loss Analysis with the MT5 Indicator
MetaTrader5
Mastering Gain/Loss Analysis with the MT5 Indicator

Gain/Loss Info Indicator for MetaTrader 5 – This handy tool displays gains and losses for all candles whenever a specified threshold is crossed. The calculations are presented in both points and percentages, making it easier to keep track of your trades. You can analyze gains and losses in two ways: by comparing the closing and opening prices of candlesticks or by looking at the difference between the current close and the previous close. Plus, you have the flexibility to set minimum change limits for pips and percentages, switch modes, and customize the font color of the output numbers. This indicator works for both MT4 and MT5 platforms. Input Parameters PercentageLimit (default = 1.0) – This sets the minimum threshold for changes to be displayed, measured in percentage points. PointsLimit (default = 1000) – This determines the minimum threshold for changes to be shown, measured in points. CloseToClose (default = true) – When set to true, the indicator compares the current close to the previous close; when false, it compares the current close to the current open. DisplayLossColor (default = clrRed) – This sets the color for displaying negative price changes. DisplayGainColor (default = clrGreen) – This defines the color for displaying positive price changes. MaxBars (default = 100) – This is the maximum number of bars the indicator will calculate on. Keep in mind, the higher the number, the more lagging the indicator may become. FontFace (default = "Verdana") – This specifies the font type used for display. FontSize (default = 10) – This determines the font size used for display. ObjectPrefix (default = "GLI-") – This is the prefix for chart objects to ensure compatibility with other indicators. The chart above illustrates the Gain/Loss Info indicator in action on GBP/USD with a W1 timeframe. Here, the percentage limit is set to 1.0%, and the pips limit is set to 1,500 pips. The calculation mode is set to 'Close vs. Previous Close,' displaying points count for the period below the candles, while percentage changes are shown above the candles. While this indicator isn't designed to generate trading signals, its primary aim is to simplify your market analysis and help identify bullish and bearish patterns. However, you can still leverage information on unusually large changes as potential entry or exit signals.

2025.01.31
Unlock Trading Success with Murrey Math Line X for MT5
MetaTrader5
Unlock Trading Success with Murrey Math Line X for MT5

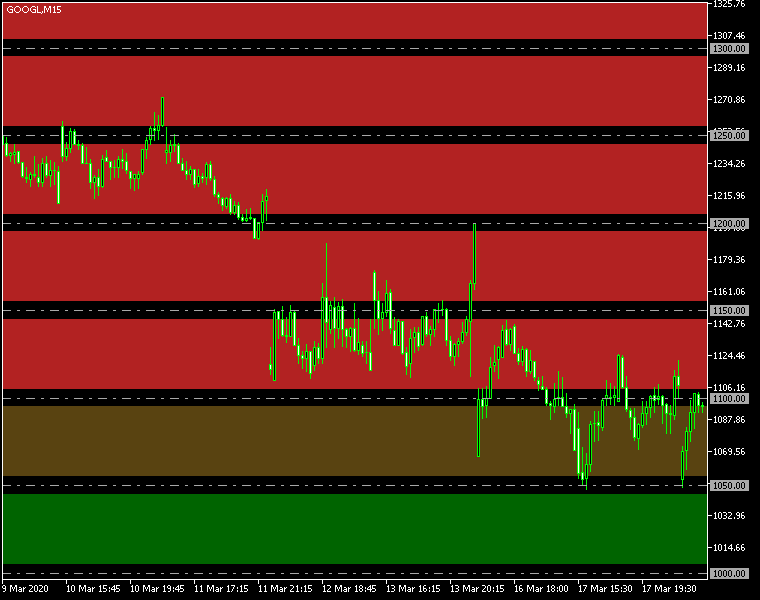
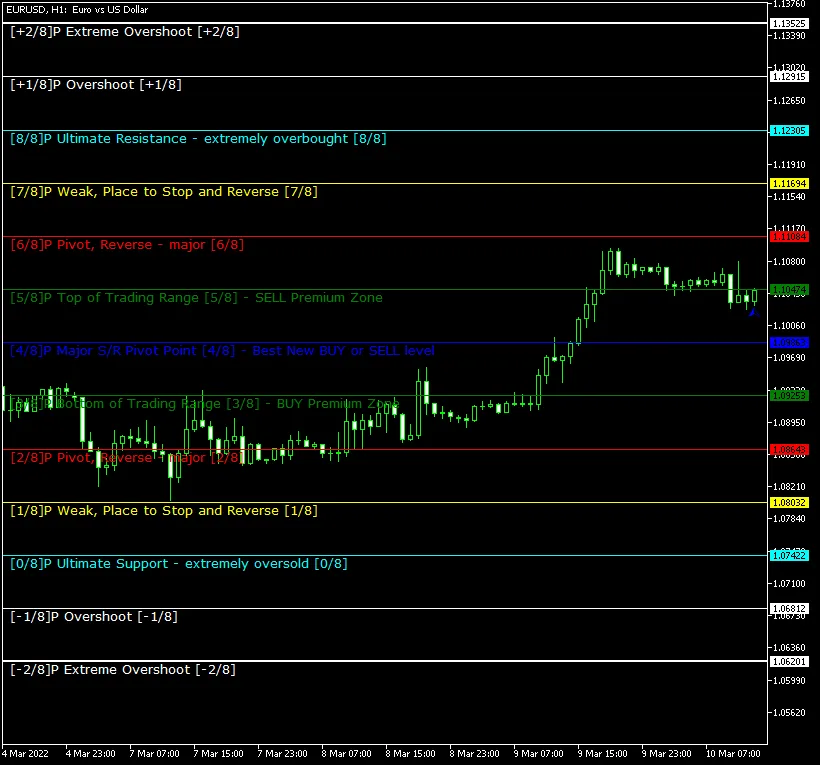
Introducing the Murrey Math Line X Indicator for MetaTrader 5 – a pivot line indicator designed to elevate your trading game, especially if you’re familiar with support, resistance, and pivot lines. This tool displays eight primary lines along with five additional ones right on your main chart, making it easier to pinpoint optimal buy and sell opportunities, as well as exit strategies. Plus, it can send you alerts whenever a candle closes after breaking through any of the pivot lines. You can grab this indicator for both the MT4 and MT5 platforms. Key Input Parameters Period (default = 64) – This refers to the number of bars or upper timeframe periods (set through the UpperTimeFrame input) used to calculate the lines. A lower number gives you more current but less reliable calculations. Upper Timeframe (default = PERIOD_D1) – This is the main timeframe. If it differs from your current one, the indicator will calculate its lines based on Period × UpperTimeframe periods. Otherwise, it will use the Period of the current chart bars. Step Back (default = 0) – This parameter adjusts how far back the lines are calculated (in current bars or through the number of UpperTimeframe periods). Label Side (default = Left) – This determines where the line labels are displayed on your screen. Choose Right only if your chart is shifted left; otherwise, the labels may be hidden. [N]/8 Color – Customize the colors for each indicator line. [N]/8 Width – Adjust the width of the indicator lines to suit your preferences. Mark Color (default = clrBlue) – This sets the color for the arrow marking the last calculated bar. Mark Number (default = 217) – This is the arrow code for the last calculated bar. Font Face (default = "Verdana") – The font style used for displaying text. Font Size (default = 10) – The size of the font displayed on your chart. Object Prefix (default = "MML-") – This is the prefix for chart objects, ensuring compatibility with other indicators. Trigger Candle (default = Previous) – The candle that will trigger alerts: Previous refers to the last closed candle, while Current refers to the candle that’s still forming. Native Alerts (default = false) – If set to true, a native MetaTrader popup alert will be triggered when a signal appears. This feature is not available in cTrader. Email Alerts (default = false) – If set to true, you’ll receive an email when a signal occurs. Be sure to configure your email settings in MetaTrader via Tools -> Options -> Email. Notification Alerts (default = false) – Similar to email alerts, but for mobile notifications. Ensure notifications are configured in MetaTrader through Tools -> Options -> Notifications. Using the Murrey Math Line X is a breeze. The 0/8P and 8/8P lines represent ultimate resistance and support levels that are tough to breach. The 1/8P and 7/8P lines offer weaker support and resistance – if the price hovers near these, it’s likely to reverse direction. The 2/8P and 6/8P lines are strong reversal points, while the 3/8P and 5/8P lines indicate the lower and upper bounds of the average trading range. Expect price action to either break through these levels quickly or linger within them for a while. The 4/8P line serves as a key support and resistance level, making it a prime spot for high-probability trading opportunities. The blue arrow you see marks the last calculated bar.

2025.01.30
Mastering Murrey Math Line X for MT4: Your Essential Indicator Guide
MetaTrader4
Mastering Murrey Math Line X for MT4: Your Essential Indicator Guide

Murrey Math Line X for MetaTrader 4 is an indispensable tool for any trader familiar with support, resistance, and pivot lines. This indicator showcases eight primary lines, plus five additional ones, directly on your main chart. Its primary purpose? To help you pinpoint optimal buy, sell, and exit opportunities. Plus, it can send alerts when a candle closes after breaching any of the pivot lines. You can easily download this indicator for both the MT4 and MT5 platforms. Input Parameters Period (default = 64) — this parameter represents the number of bars or upper timeframe periods (set via the UpperTimeFrame input) used to calculate the lines. A lower number means more up-to-date but less accurate calculations. UpperTimeframe (default = PERIOD_D1) — this is your base period. If it differs from your current timeframe, the indicator will calculate its lines using Period × UpperTimeframe. If not, it will use the Period of the current chart bars. StepBack (default = 0) — this setting allows a shift back in calculating the lines (either in the current bars or using the number of UpperTimeframe periods). LabelSide (default = Left) — this indicates where the line labels will appear on the screen. If you choose Right, ensure your chart is shifted left; otherwise, you won’t see the labels. [N]/8 Color — customize the colors for the indicator lines. [N]/8 Width — adjust the width of the indicator lines as per your preference. MarkColor (default = clrBlue) — this sets the color for the arrow marking the last calculated bar. MarkNumber (default = 217) — the arrow code for the last calculated bar's arrow. FontFace (default = "Verdana") — choose the font face for the display. FontSize (default = 10) — set your preferred font size for the display. ObjectPrefix (default = "MML-") — this prefix is used for chart objects to ensure compatibility with other indicators. TriggerCandle (default = Previous) — this parameter allows you to choose which candle will trigger alerts: Previous (the most recently closed candle) or Current (the ongoing candle). NativeAlerts (default = false) — if set to true, a native MetaTrader popup alert will trigger when a signal appears. This feature is not available in cTrader. EmailAlerts (default = false) — if this is set to true, you will receive an email notification when a signal appears. Make sure your email is properly configured in MetaTrader under Tools->Options->Email. NotificationAlerts (default = false) — if set to true, you will receive notifications when a signal appears. Notifications should be configured in MetaTrader via Tools->Options->Notifications. Using the Murrey Math Line X is straightforward. The 0/8P and 8/8P lines represent the ultimate resistance and support levels, making them tough to breach. The 1/8P and 7/8P lines are considered weak support and resistance; if the price hovers near these levels, a reversal is likely. The 2/8P and 6/8P lines serve as strong reversal points, while the 3/8P and 5/8P lines mark the extremes of the average trading range. The price may break through this range quickly or linger within it for an extended period. The 4/8P line is a crucial support and resistance level where you can execute high-probability trades when the price crosses it. The blue arrow indicates the last calculated bar.

2025.01.30
First Previous 5 6 7 8 9 10 11 12 13 14 15 Next Last