MetaTrader Free EA

Unlocking the Power of Probability: A Forex Expert Advisor for MetaTrader 5
MetaTrader5
Unlocking the Power of Probability: A Forex Expert Advisor for MetaTrader 5

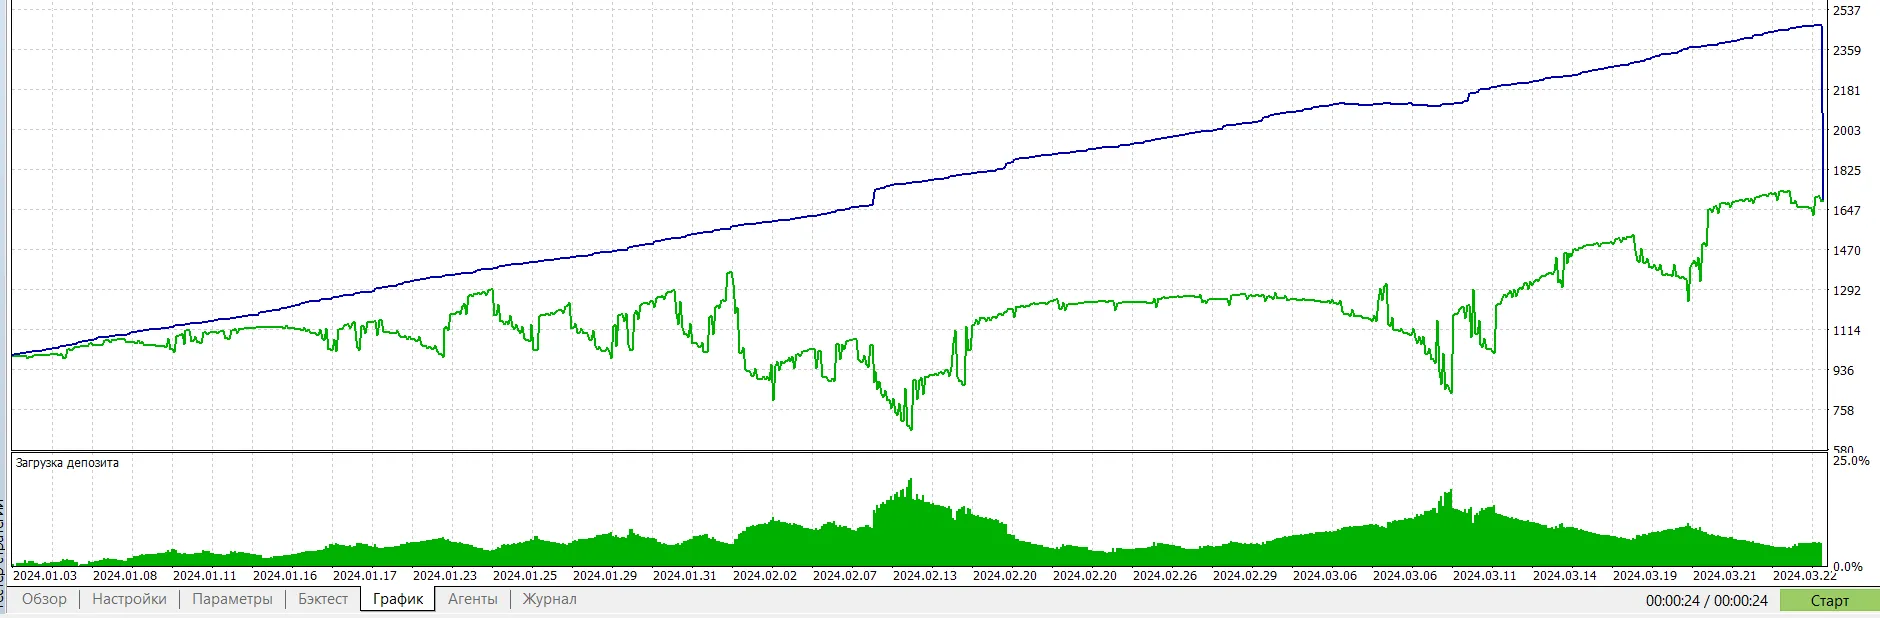
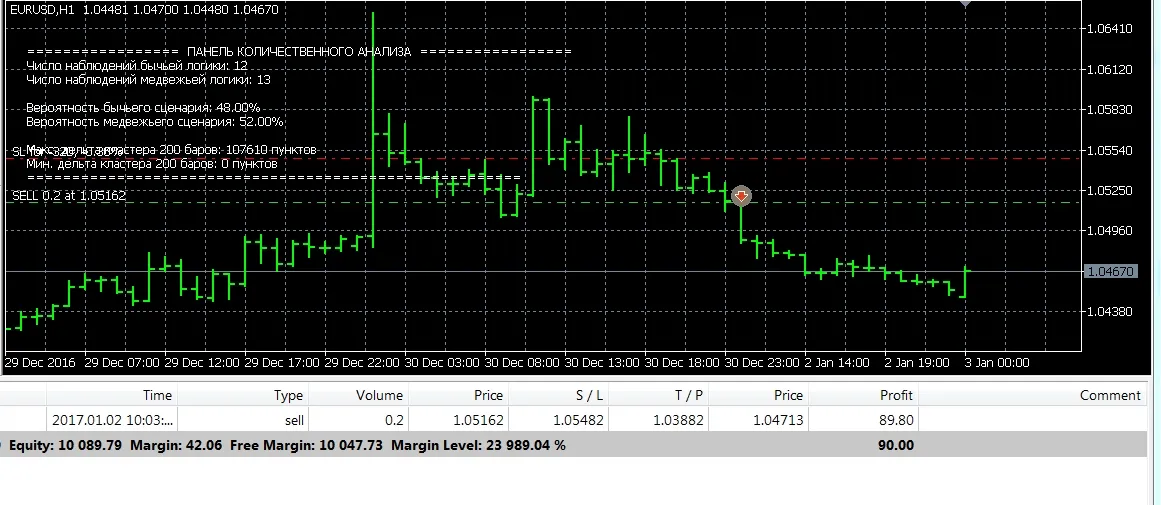
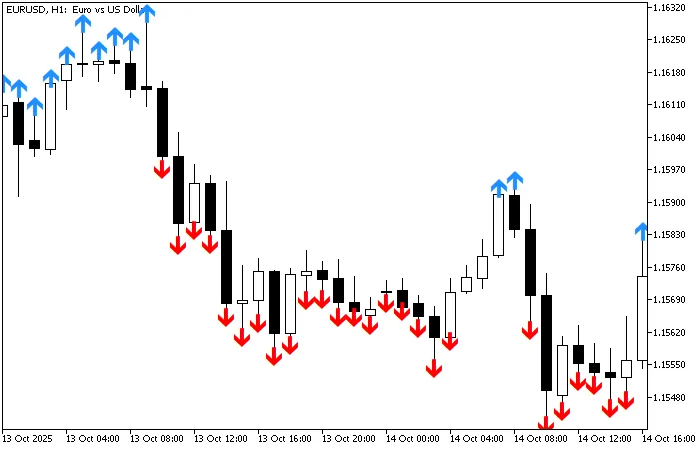
Hey there, fellow traders! Today, I’m excited to share one of my all-time favorite projects—a Forex Expert Advisor (EA) designed for the MetaTrader 5 platform that harnesses the power of probability theory. This nifty tool helps you gauge the chances of price movements in your favorite financial instruments. This EA dives into the price history of a selected asset, analyzing a default of 10,000 bars. It tracks how often the price closes above or below the opening price by a set number of pips (400 pips by default) across a cluster of bars (50 bars by default). With this data, it calculates the probabilities of price increases or decreases and displays these insights right onto your chart! But that’s not all—this EA can actually execute trades based on its probability calculations. If it determines that the likelihood of a price rise is greater than 51%, it’ll open a buy position. Conversely, if it sees a fall probability exceeding 51%, it’ll go ahead and sell. When it comes to trading positions, you have some flexibility. You can either set a fixed lot size or let the EA calculate it based on your specified risk and your current account balance. Plus, if you’ve set Stop Loss and Take Profit values, the EA will automatically adjust these levels when it opens a position. To get started, make sure to set the following flag to True: input bool EnableCheckBars = true; Just a heads-up, though—this EA isn't designed to generate profits on its own. The idea of counting movements, waves, and predicting Stop Loss or Take Profit levels with simple algorithms is a bit of a long shot. The market is a complex beast, and relying solely on this kind of analysis can be a gamble. So, there you have it! If you're looking to leverage probability theory in your trading strategy, this EA could be a valuable addition to your toolkit. Happy trading!

2025.11.04
KopierMaschineMT5: The Ultimate Trade Copier for MetaTrader 5
MetaTrader5
KopierMaschineMT5: The Ultimate Trade Copier for MetaTrader 5

If you're looking to streamline your trading experience on MetaTrader 5, then you need to check out KopierMaschineMT5. This powerful tool is designed to make trading easier and more efficient by allowing you to copy trades from multiple vendors directly to a single account. Let's dive into its features and how it works! Features The software operates in two modes: Master and Slave. Copy trades from different vendors into one slave account. Toggle Stop Loss and Take Profit copying on or off. Enable or disable the copying of pending orders. Conflict-free operation alongside other Expert Advisors. Compatible with accounts that have suffixes and prefixes. Change the trading direction as needed. Copy trades based on proportional volume relative to the balance, fixed volume, or the supplier's volume. Set conditions to open trades when the price on the slave account deviates from the provider's price by a specified amount. How It Works Ensure both the supplier's account terminal and the slave account terminal are open at the same time. On the terminal with the supplier account, set the Expert Advisor to WorkMode=Master and click the ON button on the panel. On the terminal with the subordinate account, set the Expert Advisor to WorkMode=Slave, select the provider's account on the panel, choose the desired trade copying options, and then click the ON button. Once these steps are completed, trades from the provider account will seamlessly copy over to the subordinate account. With KopierMaschineMT5, you can take your trading game to the next level. Whether you're a seasoned pro or just starting, this tool can help you make more informed trading decisions with ease!

2025.11.03
Unlocking Trading Success with SAR_MACD_EA on MetaTrader 4
MetaTrader4
Unlocking Trading Success with SAR_MACD_EA on MetaTrader 4

If you’re diving into the world of trading, you might want to take a closer look at the SAR_MACD_EA for MetaTrader 4. This expert advisor operates on a 15-minute bar or candle chart, leveraging the MACD as an early signal for market direction. The primary focus here is the Parabolic SAR, which serves as the first signal for potential buy or sell opportunities. Here’s how it works: when the close of a bar or candle indicates a price action, we look back to see if the third candle prior was below the Simple Moving Average (SMA) while the previous candle closed above it. If the SAR flips below the price at this point, that's your buy signal. If the MACD shows a bullish move and the SAR is below the price, but the previous candle's close (close[1]) remains below the SMA, the strategy dictates waiting for five candles to see if the price closes above the SMA. Let’s break this down with some examples: In the first example, you’ll notice that as soon as the candle closes below the SMA, the third candle should ideally be above it. During this timeframe, the SAR should also flip above the price. By this point, the MACD should confirm a bearish move, either simultaneously or in the previous candles. Now, here’s a look at a buy scenario: This visual demonstrates the ideal conditions for executing a buy based on our strategy. Keeping track of these signals can be a game-changer for your trading approach!

2025.10.30
Mastering Pin Bar Trading with ExpPinBar: Your Go-To Expert Advisor for MetaTrader 5
MetaTrader5
Mastering Pin Bar Trading with ExpPinBar: Your Go-To Expert Advisor for MetaTrader 5

Welcome to the world of pin bar trading! If you’re looking to refine your strategy, the ExpPinBar Expert Advisor is a fantastic tool designed specifically for trading based on the Price Action PinBar indicator. This EA opens positions based on signals generated by the indicator, and to help you manage those trades, it comes packed with a robust trailing functionality from the trailing library. You can choose from various methods like classic trailing, Parabolic SAR, moving averages, and more. Configuring Your Pin Bar Indicator Minimum Size of a Candle - This parameter sets the minimum height of a candle (in pips) that the EA will consider. Candles smaller than this are ignored, helping you filter out the noise in low-volatility markets. If you want to sift through weak signals, consider increasing this value. Maximum Candle Body Size - This defines the maximum size of the candle body relative to the full height of the candle (ranging from 0 to 1). A smaller value emphasizes classic Pin Bars, which have long shadows and small bodies. For clearer signals, values between 0.2 and 0.4 are ideal. Body Position Relative to Previous Candle - This parameter dictates how deep the body of the Pin Bar can extend into the previous candle's range. Keep values between 0.2 and 0.4 to find those classic reversal patterns where the body is near the edge. Aspect Ratio of Shadows - This sets the minimum ratio between the main shadow and the opposite shadow. Higher values (1.5 - 2.5) will filter for candles with pronounced long shadows, helping you focus on the best signals. Advisor Settings Position Volume - The size of your trade position. Slippage (in points) - The maximum price deviation you’re willing to accept during execution. Magic Number - A unique identifier for your trades. Stop Loss (in points) - Set your stop loss in points; use 0 for none or -1 to place it based on the Pin Bar shadow. Take Profit (in points) - Define your take profit level; again, use 0 for none. Stop Loss Deviation (in points) - This controls the deviation of the stop loss from the Pin Bar shadow. Trailing Settings Trailing Type - Choose your preferred trailing method. Trailing Start - Set the profit level at which trailing will start. Trailing Step (in points) - Define the step size for the trailing mechanism. Trailing Offset (in points) - Set how far from the current price your trailing stop should be. Indicator Settings Used in Trailing Indicator's Timeframe - The timeframe for the indicator used in trailing calculations. MA Period - The calculation period for the moving average. MA Shift - The horizontal shift applied to the moving average. AMA Fast EMA Period - The fast EMA period for the adaptive moving average. AMA Slow EMA Period - The slow EMA period for the adaptive moving average. VIDYA CMO Period - The CMO period for dynamic averaging. Parabolic SAR Step - The step for the Parabolic SAR indicator. Parabolic SAR Max - The maximum value for the Parabolic SAR. MA Applied Price - Determines the price used for moving average calculations. MA Smoothing Method - The type of smoothing applied to the moving average. Indicator Data Index - The specific bar of data from the indicator. To get started with the iPinBars indicator and the trailing classes library is essential for the Expert Advisor to function smoothly. Here’s a glimpse of how the Expert Advisor performed over the past year on the EURUSD H4 chart, utilizing fixed stop levels and a straightforward trailing approach:

2025.10.22
Unlock Your Trading Potential: The ExpWPRBB Expert Advisor for MetaTrader 5
MetaTrader5
Unlock Your Trading Potential: The ExpWPRBB Expert Advisor for MetaTrader 5

Hey fellow traders! Today, I want to introduce you to the ExpWPRBB Expert Advisor, a nifty tool designed for MetaTrader 5 that employs a straightforward trading strategy using two powerful indicators: the Williams' Percent Range (WPR) and Bollinger Bands (BB). This EA only opens positions when both indicators align, making it a reliable choice for those looking to streamline their trading. How It Works Here’s the lowdown on how the ExpWPRBB operates: Buy Signal: The WPR exits the oversold zone, and the opening price of the bar is below the average BB line. Sell Signal: The WPR comes out of the overbought zone, and the opening price of the bar is above the average BB line. The width of the Bollinger Bands, combined with the ATR (Average True Range), is used to set your Stop Loss and Take Profit levels. A key point to remember is that this EA works exclusively on hedging accounts. Plus, it features a non-trading mode where you can display signal labels, allowing you to monitor signals visually in the strategy tester. Input Parameters Let’s dive into the specifics: WPR (Williams' Percent Range) InpPeriodWPR: This is the period for WPR calculation, representing the number of bars for the indicator's value. InpOverboughtWPR: The overbought level for WPR, usually set between -20 to 0. InpOversoldWPR: The oversold level for WPR, typically ranging from -80 to -100. BB (Bollinger Bands) InpPeriodBB: The period for calculating the Bollinger Bands. InpDeviationBB: This is the standard deviation multiplier for determining the bands' width. InpShiftBB: The shift of the Bollinger Bands relative to the current bar. InpPriceBB: The price type used for calculating the Bollinger Bands. ATR (Average True Range) InpPeriodATR: The period for calculating the ATR, based on the number of bars. Trading Settings InpSignalsOnly: If true, the EA will only place signal labels without executing trades. InpVolume: This refers to the position volume, or lot size, for opening trades. InpDeviation: Slippage in points, indicating the maximum allowable price deviation when executing an order. InpMagic: A unique identifier for the EA's positions, useful for tracking. InpStopLoss: The Stop Loss level in points; set to 0 if not used, or -1 for automatic calculation based on Bollinger Bands width. InpTakeProfit: The Take Profit level in pips; set to 0 if not used, or -1 for automatic calculation based on ATR value. InpSLMltp: A multiplier for adjusting the Stop Loss size if it's set to -1. InpTPMltp: A multiplier for adjusting the Take Profit size if it's set to -1. The default values for these parameters are optimized for testing on the H4 chart period, making it a great starting point. Test Results Check out these test results using the default parameters on the H4 chart: Happy trading, and may your charts be ever in your favor!

2025.10.21
Unlock Trading Success with Heikin Ashi EA for MetaTrader 4
MetaTrader4
Unlock Trading Success with Heikin Ashi EA for MetaTrader 4

Are you ready to take your trading to the next level? Meet the Heikin Ashi EA for MetaTrader 4, designed specifically to harness the power of Heikin Ashi candles. This Expert Advisor (EA) smooths out price action and filters the market noise, giving you a crystal-clear view of market trends. With this EA, you can ride the strong trends, steer clear of false reversals, and trade with confidence! Key Features & Parameters 1. Heikin Ashi Candle Integration Smoothed Trend Visualization – Say goodbye to random noise and hello to clearer signals. Bullish/Bearish Color Detection – This EA only trades when there’s a definitive trend shift in the Heikin Ashi candles. Customizable Heikin Ashi Settings – Tailor the smoothing options to align with your trading strategy. 2. Smart Trade Management Close on Trend Flip – Get out of trades promptly when the candle colors change. Equity & Profit Controls – Automatically close all trades when your floating profit or loss hits your predefined level. Why You Should Use Heikin Ashi TrendMap EA ✅ Clear Trend Detection – Filters out choppy price movements and misleading signals.✅ Works on Any Pair & Timeframe – Perfect for everything from scalping to swing trading.✅ Hands-Free Automation – Executes trades without any delays or second-guessing.✅ Emotion-Free Trading – Trades are based on Heikin Ashi rules, eliminating human error.✅ Flexible Settings – Adaptable for both aggressive and conservative trading styles.

2025.10.14

MetaTrader Free Indicators

Mastering the Open Range Breakout Indicator for MetaTrader 5
MetaTrader5
Mastering the Open Range Breakout Indicator for MetaTrader 5

Overview The Open Range Breakout (ORB) indicator is a game changer for traders looking to pinpoint price breakouts from the day's opening range. The idea behind this tool is straightforward: the high and low prices set during the first few minutes of a trading session often act as vital support and resistance levels for the rest of the day. This nifty indicator automatically calculates the opening range based on your chosen time frame, plots multiple price targets, and even gives you visual and audio alerts for potential trading setups. It’s all about helping you spot high-probability breakout trades and retests! Core Concept The ORB strategy hinges on the fact that traders establish an initial price range when the market opens. When the price breaks free from this range with momentum, it typically continues in the breakout direction. This indicator tracks that opening range and forecasts multiple profit targets based on its size. Key features include automatic breakout detection, retest identification, and progressive profit targets calculated as multiples of the opening range. Indicator Parameters Basic Settings sOpeningRangeMinutes (default: "15") This sets the length of the opening range in minutes. Options are 5, 15, or 30 minutes, or 0 for custom ranges. The 15-minute opening range (9:30-9:45 EST) is popular for US equities, while shorter periods work well in faster markets. alertBreakoutsOnly (default: false) When this is enabled, alerts trigger only on confirmed breakouts, not just price crossing the ORB levels. This helps filter out false signals by ensuring the price closes beyond the range and continues in the breakout direction. showLabels (default: true) This option shows labels for all ORB levels and price targets on your chart, indicating "ORB HIGH", "ORB LOW", and percentage-based profit targets (PT 50%, PT 100%, etc.). showPreviousDayORBs (default: true) This controls whether ORB levels from previous sessions appear on your chart. Disable it to show only the current day's ORB, which can clean up your view. showEntries (default: true) This enables visual markers for potential entry points, including labels like "Breakout - Wait for Retest", "Retest", and "Failed Retest". These help you pinpoint the best entry timing. Display Options showPriceTargets (default: true) Displays primary profit targets at 50% and 100% of the opening range, which are commonly used for taking partial profits. showPriceTargetsExtended (default: false) Adds extended profit targets from 150% to 500% of the opening range, perfect for trending markets or volatile instruments like gold (XAUUSD). showMidPoint (default: false) Plots a line in the center of the opening range, which often acts as a pivot level for mean reversion strategies. showShadedBox (default: true) This features a filled rectangle over the opening range, giving you a clear visual cue of the ORB zone. Color Customization shadeColor (default: clrTeal) This sets the color for the shaded rectangle of the opening range. orb50Color (default: clrPurple) Color for the 50% profit target lines. orb100Color (default: clrBlue) Color for the 100% profit target lines. orbOtherColor (default: clrTeal) Color for all extended profit targets (150% to 450%). Time Settings sORBStartTime (default: "0930-0945") Custom time in 24-hour format (HHMM-HHMM) when sOpeningRangeMinutes is set to 0, allowing flexibility in defining the opening range. sTimeZone (default: "EST") The timezone for the opening range calculation. The indicator calculates times based on your broker's server time. Label Formatting labelOffsetBars (default: 5) This adjusts the horizontal spacing between current price action and label position. Positive values shift labels to the right. labelOffsetPips (default: 0) This adjusts vertical spacing for label positioning, preventing overlap with price action or other elements. labelFontSize (default: 8) The font size for all text labels on your chart, which you can tweak based on your screen resolution. labelAnchor (default: ANCHOR_LEFT) This sets the anchor point for label positioning, with options like ANCHOR_LEFT, ANCHOR_RIGHT, ANCHOR_CENTER, etc. maxLineBars (default: 500) This limits the line length for ORB level lines, preventing excessively long lines on historical data for better performance. How the Indicator Works Opening Range Calculation The indicator identifies the opening range by monitoring the specified time and recording the highest high and lowest low during that period. For instance, with a 15-minute setup, it captures the range from 9:30 to 9:45. Once the opening range time is up, the high and low levels are locked in and extended forward as horizontal lines for the rest of the trading session. Price Target Calculation All profit targets are calculated as multiples of the opening range size. If the range is 20 points, the 50% target is 10 points beyond the ORB high (for long trades) or below the ORB low (for short trades). This ensures profit targets adjust to market volatility, with larger ranges leading to wider targets. Breakout Detection Logic The indicator uses multi-bar confirmation for breakout signals. A valid breakout needs the price to close above the ORB high on one bar, then continue higher on the next bar with the low staying above the ORB high. This helps filter out false breakouts where price just spikes through the level before reversing. For downside breakouts, the price needs to close below the ORB low and continue with highs remaining below that level. Retest Identification After a confirmed breakout, the indicator looks for pullbacks to the broken level. A valid retest occurs when price touches the ORB level and closes on the correct side, confirming the level has flipped from resistance to support (or vice versa). Failed retests are flagged when price breaks back through the ORB level in the opposite direction, invalidating the original breakout signal. Interpretation and Trading Applications Breakout Trading Strategy The main use of this indicator is to spot high-probability breakout trades. When price breaks out of the opening range with volume, traders can jump in the direction of the breakout, placing stops below the ORB low (for longs) or above the ORB high (for shorts). The first profit target is generally the 50% level, where you can take partial profits. The remaining position can target the 100% level or beyond in strongly trending conditions. Retest Entry Method If you're on the more conservative side, waiting for a retest after the initial breakout is a solid strategy. The "Breakout - Wait for Retest" label signals this opportunity. When price pulls back to test the broken level and finds support (or resistance), it gives you a lower-risk entry point with a tighter stop loss. This method significantly improves the risk-reward ratio compared to jumping on the initial breakout. Range-Bound Trading When the price stays within the opening range, you can use mean reversion strategies, buying near the ORB low and selling near the ORB high. The midpoint line serves as a reference for neutral positioning. Multi-Timeframe Analysis This indicator can be applied across multiple timeframes. Many traders use a 5-minute ORB for scalping, a 15-minute ORB for day trading, and a 30-minute ORB for swing trading, providing a comprehensive view of potential support and resistance zones. Recommended Symbols and Timeframes Optimal Timeframes The indicator shines on 1-minute (M1) to 15-minute (M15) charts, where intraday price action is clear. The M5 timeframe hits a sweet spot between reducing noise and maintaining responsiveness. Suitable Instruments The ORB strategy works wonders on liquid instruments with distinct opening sessions: Forex pairs: EURUSD, GBPUSD, USDJPY at their respective regional opens Gold (XAUUSD): Very responsive to opening range breakouts due to strong directional moves Stock indices: US30, NAS100, SPX500 during the New York session open Cryptocurrencies: BTCUSD, ETHUSD during high-volume periods The indicator performs best on instruments with defined trading sessions rather than 24-hour markets without clear opening times. Performance Optimization The indicator comes with several performance enhancements for seamless chart operation. Buffer initialization to EMPTY_VALUE prevents unnecessary line drawing, while the maxLineBars parameter limits the length of historical lines. The rectangle drawing logic waits until the session wraps up before rendering, which cuts down on computational overhead during active trading. Object naming conventions use unique identifiers based on the day of the year, preventing conflicts when multiple ORB sessions are displayed at once. Alert System The notification system gives you real-time alerts through MetaTrader 5’s built-in alert feature. You can configure alerts for simple level crossings or restrict them to confirmed breakouts only. When a breakout happens, the alert message specifies whether it’s above the ORB high or below the ORB low, allowing you to quickly assess opportunities without constantly monitoring the chart. Visual Presentation All chart elements adhere to professional formatting standards with customizable colors. The default color scheme uses lime for ORB high, red for ORB low, purple for 50% targets, blue for 100% targets, and teal for extended targets and the shaded range box. This color-coding system enables quick visual identification of key levels, even on busy charts. The shaded rectangle serves as an intuitive visual reference for the opening range period, making it clear when the price trades within or outside the established range. Conclusion The Open Range Breakout indicator is a powerful trading tool that combines automatic range calculation, multiple profit targets, breakout detection, and retest identification into one easy-to-use package. Its flexibility through extensive input parameters allows you to tailor the indicator to various trading styles, from aggressive breakout trading to conservative retest entries. With its clean visual presentation and logical alert system, it suits both discretionary traders and those developing automated trading strategies. By focusing on the key opening range period, it helps traders identify the most significant support and resistance levels for each trading session.

2025.11.13
Mastering the Statistical Zigzag Indicator for MetaTrader 5
MetaTrader5
Mastering the Statistical Zigzag Indicator for MetaTrader 5

What is the Statistical Zigzag Indicator? The Statistical Zigzag indicator is a powerful tool for traders using MetaTrader 5. It helps identify swing points by confirming them when the price surpasses a specific volatility threshold. This threshold is calculated as the current standard deviation × multiplier. How It Works Unlike traditional methods that look for fixed highs and lows, this indicator assesses extremes based on local volatility. It captures the most extreme price within the move that triggered the threshold, adapting dynamically to the market's ever-changing conditions. Since the standard deviation updates with each new bar, you're always in tune with the current market trends. Understanding the Projected Levels Once a swing point is confirmed, a horizontal line projects from it, creating a statistically meaningful boundary. This line acts as a key level where the price is likely to either bounce back or break through. Think of it as a support or resistance level that you can trade off. Trading Strategies with Zigzag In a bearish trend, consider viewing any price movement above this projected level as mere noise. You might want to set a sell stop just below the line or enter directly at the level, exiting at breakeven if the price starts to go against your position. Key Inputs to Understand Length: A higher length will result in longer legs and fewer turning points, while a lower length will produce shorter legs and more turning points. Volatility Multiplier: A higher multiplier means the threshold is harder to breach, leading to more rigid legs. Conversely, a lower multiplier makes it easier to trigger, creating more responsive legs.

2025.11.07
Unlocking Market Trends with the Custom EMA Indicator for MT5
MetaTrader5
Unlocking Market Trends with the Custom EMA Indicator for MT5

Are you on the lookout for a powerful tool to enhance your trading game? Look no further! This free custom Exponential Moving Average (EMA) indicator is designed specifically for MetaTrader 5, and it’s here to help you identify trends and generate signals right from your chart. The EMA is a go-to technical tool among traders for its ability to smooth out price data and provide insights into potential market movements. Features User-defined period for the EMA, allowing you to tailor it to your strategy. Versatile choice of applied price: Close, Open, High, Low, Median, Typical, or Weighted. Smooth calculations based on the standard EMA formula, initialized with an SMA of the first bars. Lightweight and efficient, making it easy to customize for your unique trading strategies. 📊 How to Interpret The EMA responds quicker to price changes compared to the Simple Moving Average (SMA). If the price is above the EMA, it often signals an uptrend; conversely, if it’s below the EMA, it could indicate a downtrend. This indicator is frequently employed in strategies such as: Trend-following Moving average crossovers (like EMA 50 crossing EMA 200). ⚙️ Customisation Adjust the line color and thickness to fit your style. Change the applied price and period easily in the input settings. Why Use This Indicator? It helps you identify market direction quickly, giving you the edge in your trades. This can serve as a building block for more advanced trading strategies. Ideal for traders looking for a clean and straightforward EMA implementation.

2025.11.02
Unlocking Trading Insights with the Cumulative Volume Delta (CVD) Indicator for MetaTrader 5
MetaTrader5
Unlocking Trading Insights with the Cumulative Volume Delta (CVD) Indicator for MetaTrader 5

Looking to sharpen your trading edge? The Cumulative Volume Delta (CVD) indicator for MetaTrader 5 is a lightweight, open-source tool that visualizes the net buying and selling pressure as CVD candles in a separate window. It’s an excellent starting point for diving into volume and order flow analysis. What It Does Calculates and displays CVD on your chart using M1 data (this is the free version) Offers an option to reset on timeframe boundaries or to keep it running without resets Compatible with any symbol and timeframe, giving you flexibility in your trading How It’s Calculated (Free Version) For each M1 candle: direction = sign(close − open) Volume delta = direction × tick_volume CVD = cumulative sum of volume deltas Displayed as candles (open/close = previous/current CVD) Inputs InpResetPeriod (ENUM_TIMEFRAMES): Choose a timeframe to reset CVD (e.g., H1, D1) InpNoReset (bool): Set to true if you prefer to never reset How to Install Copy CVD_MT5_v3_m1_codebase.mq5 to: MQL5/Indicators Compile it in MetaEditor (just hit F7) or restart MetaTrader 5 Attach it from the Navigator under Indicators Tips & Troubleshooting On your first run, MetaTrader 5 may need to download M1 history. So, be patient! Scrolling through the chart or switching timeframes can help MT5 fetch the necessary data. If CVD doesn’t seem to update, double-check that your chosen symbol/timeframe has M1 history available. For those with slow terminals, consider trading less busy symbols or keeping fewer charts open to boost performance.

2025.11.02
Mastering Market Moves with Wave Weis Bar Force for MetaTrader 5
MetaTrader5
Mastering Market Moves with Wave Weis Bar Force for MetaTrader 5

Wave Weis Bar Force: Understanding Accumulated Wave Volume Wave Weis Bar Force is a powerful indicator designed to utilize the principles of volume waves (Weis) to pinpoint accumulation phases and shifts in market direction. This tool aggregates volume while the trend remains stable, and when the trend shifts, it initiates a new wave and resets the accumulation count to zero. You can monitor the intensity of these movements through the Intensity window, which compares the current wave's volume to the highest recent accumulation. Input Parameters Volume Type: This setting allows you to choose your volume source—either tick or real volume. Intensity: This parameter defines the bar window used for intensity reference. Bullish Levels (1 to 4): A scale of green, ranging from the lightest shade to LIME. Bearish Levels (1 to 4): A scale of red, from the lightest to RED. Here's an example of the input parameters screen: Visual Interpretation Bullish Levels Level 1: Very light green (indicating a low intensity wave). Level 2: Light green. Level 3: Medium green. Level 4: LIME (signifying the maximum intensity bullish wave). Bearish Levels Level 1: Very light red (indicating a low intensity wave). Level 2: Light red. Level 3: Medium red. Level 4: RED (signifying the maximum intensity bearish wave). WaveMax (white): This marks the bar representing the highest volume within the current wave. WaveClimax (yellow): This marks when the current wave's accumulation surpasses the best historical accumulation. Here's an example of the indicator applied to a chart: Quick Notes Only the current cumulative value is shown in the legend for simplicity. WaveMax and WaveClimax markers are hidden by default to keep the display clean. This indicator is versatile for any asset and timeframe, making it especially handy for intraday analysis.

2025.10.25

Crypto Market

Currency Pair
Current
Start Price
High
Low
Change
Change %
BTCUSDT
83,763.57
82,888.97
85,620.00
80,600.00
874.60
+1.06 %
ETHUSDT
2,712.53
2,701.87
2,806.84
2,623.57
10.66
+0.39 %
XRPUSDT
1.9032
1.9012
1.9984
1.8209
0.0020
+0.11 %
SOLUSDT
125.91
125.33
130.62
121.66
0.58
+0.46 %
DOGEUSDT
0.13684
0.13796
0.14350
0.13321
-0.00112
-0.81 %
TRXUSDT
0.2738
0.2768
0.2780
0.2737
-0.0030
-1.08 %
ADAUSDT
0.3991
0.4031
0.4177
0.3876
-0.0040
-0.99 %

FX Margin Market

Currency Pair
Current
Start Price
High
Low
Change
Change %
EURUSD
0
0
0
0
0
+0.00 %
GBPUSD
0
0
0
0
0
+0.00 %
USDJPY
0
0
0
0
0
+0.00 %
AUDUSD
0
0
0
0
0
+0.00 %
USDCAD
0
0
0
0
0
+0.00 %
NZDUSD
0
0
0
0
0
+0.00 %